PromCon EU 2024 Highlights
4 minute read
Overview
Many innovative observability and application performance management (APM) products and services were released over the last few years. They often adopt or enhance concepts that Prometheus invented more than a decade ago. However, Prometheus, as an open-source project, has never lost its importance in this fast-moving industry and is the core of Gardener’s monitoring stack.
On September 11th and 12th, Prometheus developers and users met for PromCon EU 2024 in Berlin. The single-track conference provided a good mix of talks about the latest Prometheus development and governance by many core contributors, as well as users who shared their experiences with monitoring in a cloud-native environment. The overarching topic of the event was the upcoming Prometheus 3.0 release. Many of the presented innovations will also be interesting for the future of Gardener’s observability stack. We will take a closer look at the changes in the Prometheus and Perses projects in the remainder of this article.

Prometheus 3.0 - OpenTelemetry Everywhere
A first beta version of Prometheus 3.0 was released during the first day of the conference. The main focus of the new major release is compatibility with OpenTelemetry and full support for metric ingestion using the OpenTelemetry protocol (OTLP). While OpenTelemetry and Prometheus metrics have many things in common, a lot of incompatibilities still need to be sorted out.
One of the differences can be found in the naming conventions for metrics and label or attribute names. Instead of simply replacing dots with underscores, the Prometheus developers decided to introduce full UTF-8 support to achieve the best possible compatibility. This plan brought up interesting syntactical challenges for PromQL queries, as well as a demand for conversion when interacting with systems that still have the restrictions of previous Prometheus releases.
The development of native histograms in Prometheus has been ongoing for a while. The more efficient way to represent histograms also contributes to OpenTelemetry compatibility.
While Prometheus traditionally uses labels to enrich a time series with metadata, OpenTelemetry describes the concepts of metric attributes and resource attributes. While the new release contains a new Info PromQL function to ease the enrichment with resource attributes, the development of a new metadata store has been initiated to improve the experience even more in the long term.
A new UI makes the creation of ad-hoc queries easier and provides better feedback about the structure of a query and possible mistakes to the user.
The Prometheus project has reached a high level of maturity after more than 12 years of development by an active community of contributors. To ensure that the community can continue growing, a new governance model was proposed, including clearly defined roles and a new steering committee.
Perses - The New Kid in The Sandbox
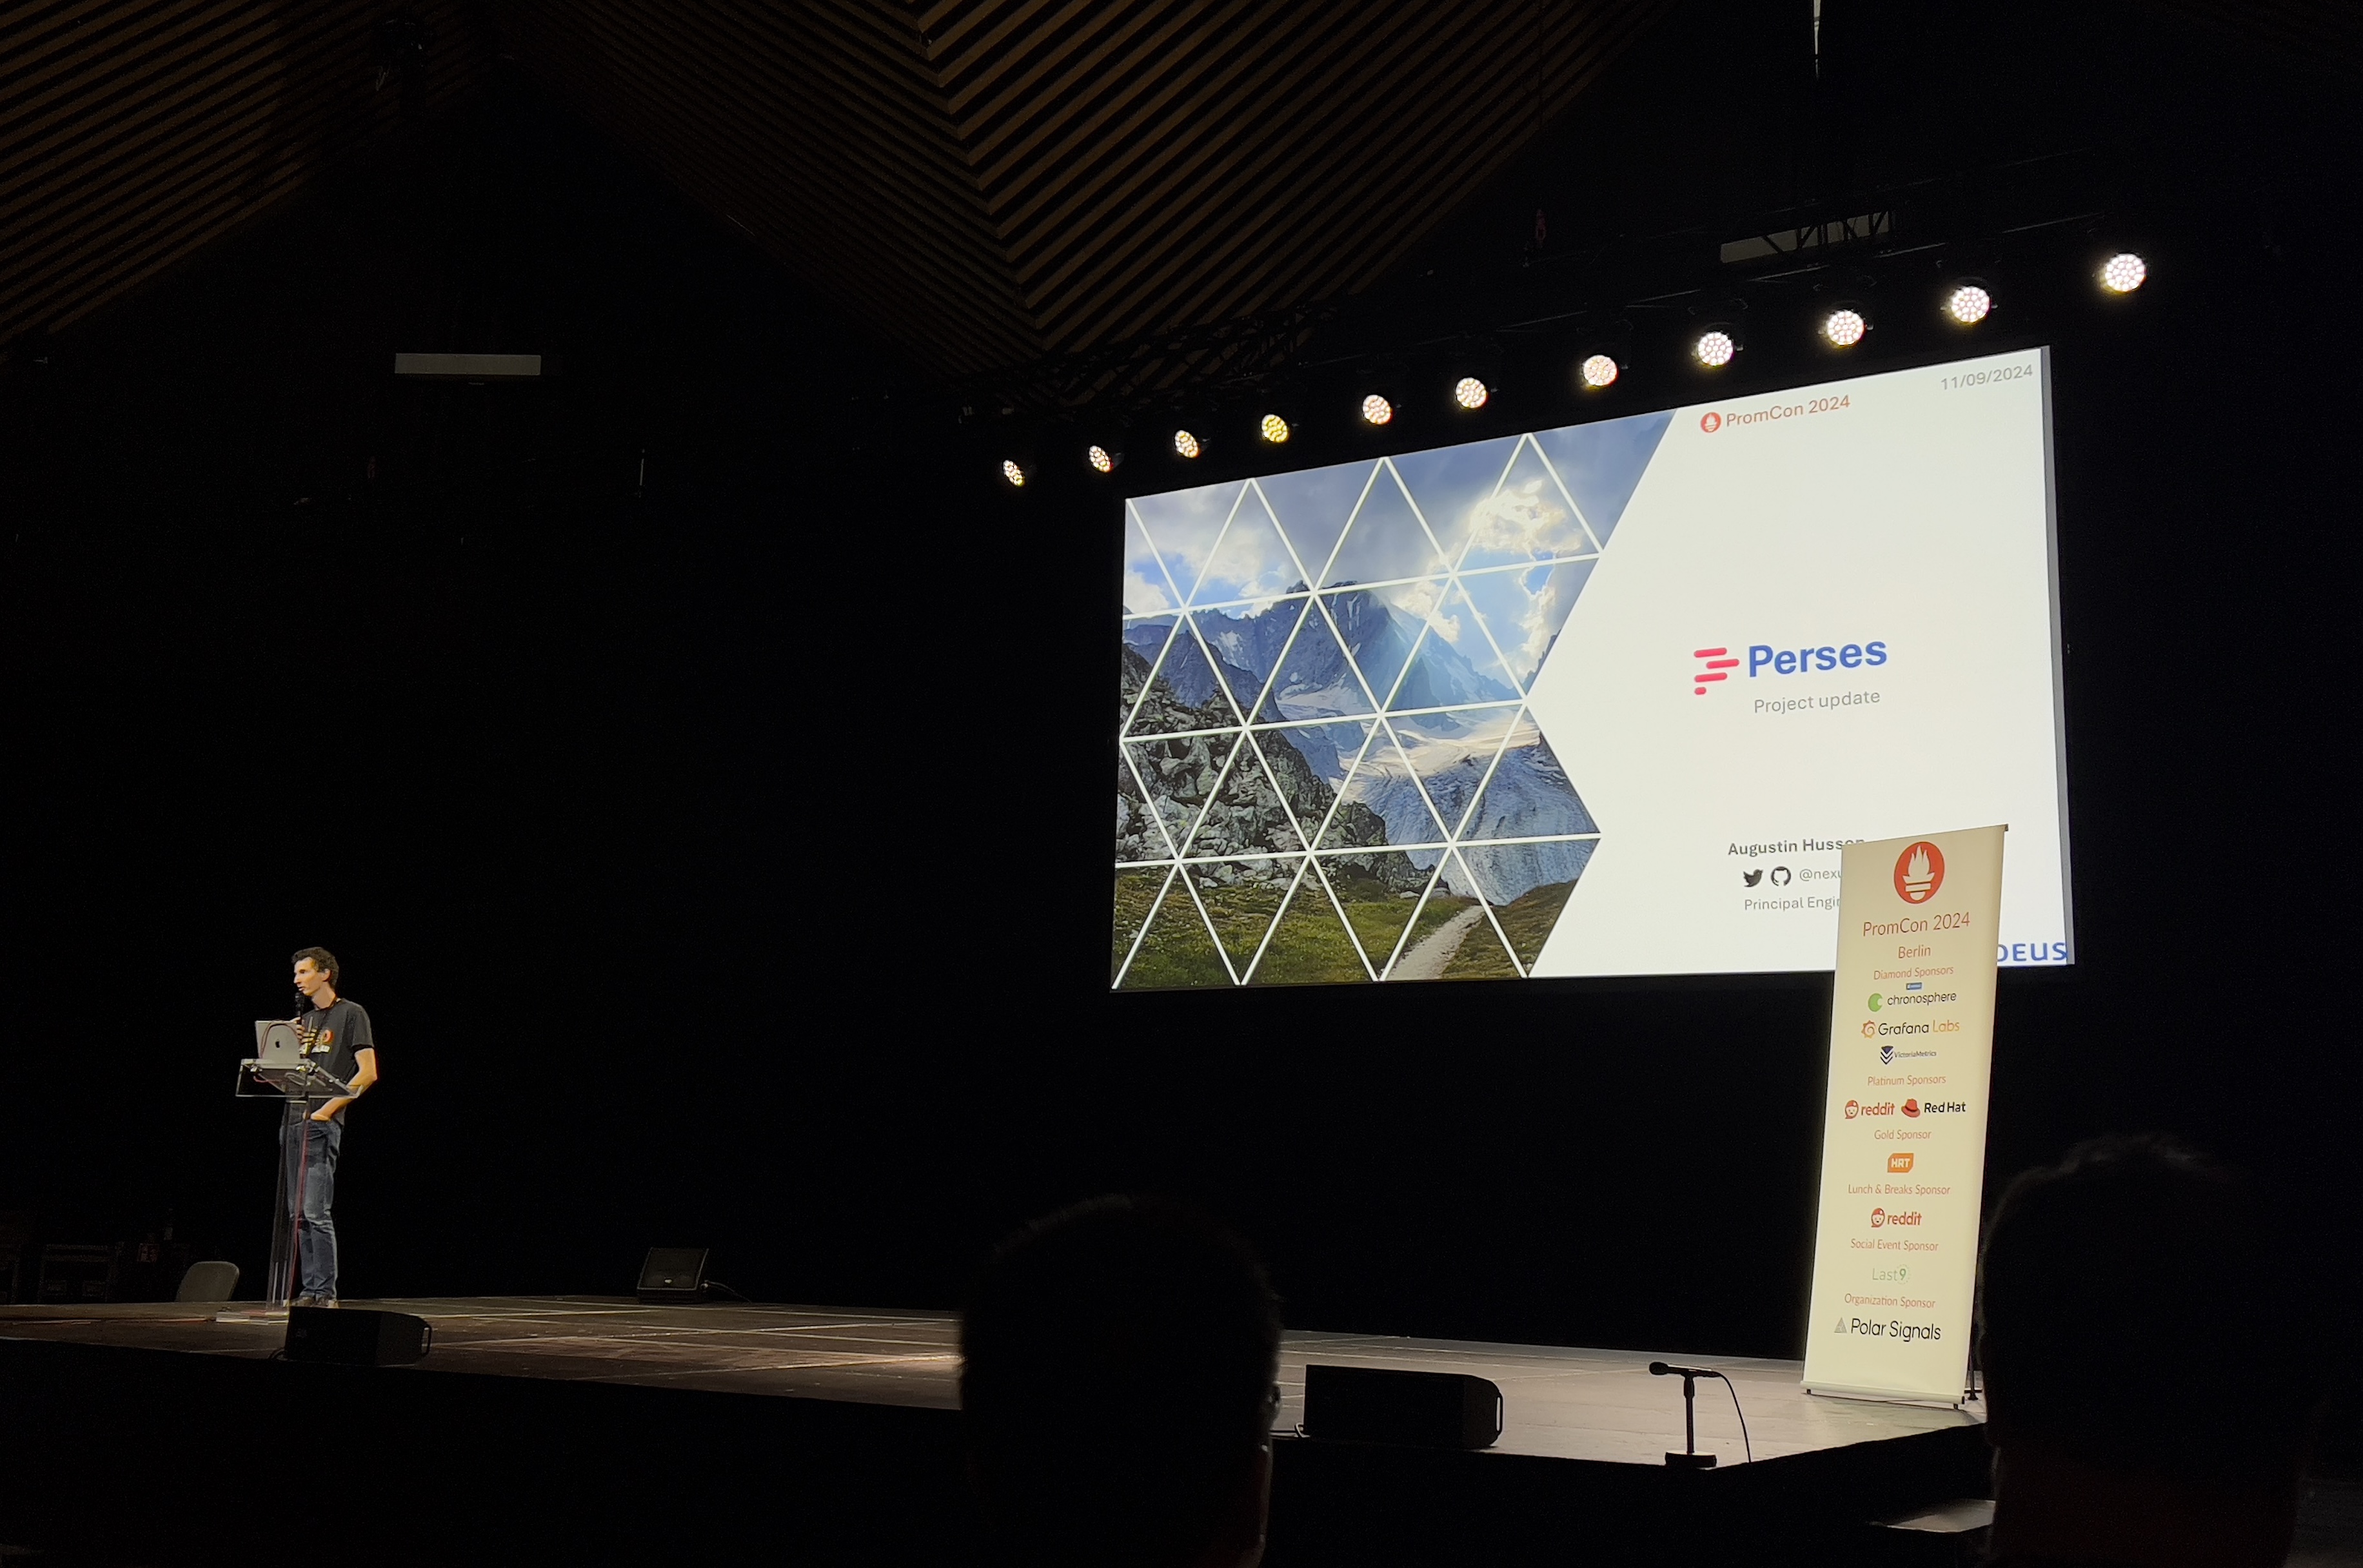
Perses was of particular interest to us working on monitoring at Gardener. As you may know, Gardener is currently using Plutono, a fork of Grafana’s most recent Apache-licensed version. This was introduced in g/g#7318 over a year ago and intended as a stop-gap solution. Since then, we have been interested in finding a more sustainable solution, as we’re cut off from the enhancements to Grafana. If you’ve ever made a change to a dashboard in Gardener, you’ll know that there are some pain points in working with Plutono. Therefore, we were looking forward especially to a talk on a project known as Perses. An open-source dashboard solution that recently joined the CNCF as a sandbox project. Driven by development from Amadeus, Chronosphere, and Red Hat Openshift, Perses already offers a variety of dashboard panels, supports dashboards-as-code workflows, and has data-source plugins for metrics and distributed traces. It also brings tooling to convert Grafana dashboards to Perses, which also works for Plutono! Adjacent to the Perses project itself is a Perses operator which enables deployment of Perses on Kubernetes using Custom Resource Definitions (CRDs). This is not a new concept - we also use the Prometheus operator in Gardener and would like to use it for Perses as well. One of the areas in which Perses is still lacking is the ability to use it to visualize logs, a key feature of Plutono. With work on the plugin architecture continuing, we hope to be able to work on this feature in the not-too-distant future. We are excited to see how Perses will develop and are looking forward to contributing to the project.
Conclusion
PromCon EU 2024 brought together open-source developers, commercial vendors, and users of observability tools. The event provided excellent learning opportunities during many high-quality talks and the chance to network with peers from the community while enjoying a BBQ after the first conference day. The large and healthy Prometheus community shows that open-source observability tools can coexist with commercial solutions.