Logging and Monitoring for Extensions
Gardener provides an integrated logging and monitoring stack for alerting, monitoring, and troubleshooting of its managed components by operators or end users. For further information how to make use of it in these roles, refer to the corresponding guides for exploring logs and for monitoring with Plutono.
The components that constitute the logging and monitoring stack are managed by Gardener. By default, it deploys Prometheus and Alertmanager (managed via prometheus-operator, and Plutono into the garden namespace of all seed clusters. If the logging is enabled in the gardenlet configuration (logging.enabled), it will deploy fluent-operator and Vali in the garden namespace too.
Each shoot namespace hosts managed logging and monitoring components. As part of the shoot reconciliation flow, Gardener deploys a shoot-specific Prometheus, blackbox-exporter, Plutono, and, if configured, an Alertmanager into the shoot namespace, next to the other control plane components. If the logging is enabled in the gardenlet configuration (logging.enabled) and the shoot purpose is not testing, it deploys a shoot-specific Vali in the shoot namespace too.
The logging and monitoring stack is extensible by configuration. Gardener extensions can take advantage of that and contribute monitoring configurations encoded in ConfigMaps for their own, specific dashboards, alerts and other supported assets and integrate with it. As with other Gardener resources, they will be continuously reconciled. The extensions can also deploy directly fluent-operator custom resources which will be created in the seed cluster and plugged into the fluent-bit instance.
This guide is about the roles and extensibility options of the logging and monitoring stack components, and how to integrate extensions with:
Monitoring
Seed Cluster
Cache Prometheus
The central Prometheus instance in the garden namespace (called "cache Prometheus") fetches metrics and data from all seed cluster nodes and all seed cluster pods. It uses the federation concept to allow the shoot-specific instances to scrape only the metrics for the pods of the control plane they are responsible for. This mechanism allows to scrape the metrics for the nodes/pods once for the whole cluster, and to have them distributed afterwards. For more details, continue reading here.
Typically, this is not necessary, but in case an extension wants to extend the configuration for this cache Prometheus, they can create the prometheus-operator's custom resources and label them with prometheus=cache, for example:
apiVersion: monitoring.coreos.com/v1
kind: ServiceMonitor
metadata:
  labels:
    prometheus: cache
  name: cache-my-component
  namespace: garden
spec:
  selector:
    matchLabels:
      app: my-component
  endpoints:
  - metricRelabelings:
    - action: keep
      regex: ^(metric1|metric2|...)$
      sourceLabels:
      - __name__
    port: metrics
Seed Prometheus
Another Prometheus instance in the garden namespace (called "seed Prometheus") fetches metrics and data from seed system components, kubelets, cAdvisors, and extensions. If you want your extension pods to be scraped then they must be annotated with prometheus.io/scrape=true and prometheus.io/port=<metrics-port>. For more details, continue reading here.
Typically, this is not necessary, but in case an extension wants to extend the configuration for this seed Prometheus, they can create the prometheus-operator's custom resources and label them with prometheus=seed, for example:
apiVersion: monitoring.coreos.com/v1
kind: ServiceMonitor
metadata:
  labels:
    prometheus: seed
  name: seed-my-component
  namespace: garden
spec:
  selector:
    matchLabels:
      app: my-component
  endpoints:
  - metricRelabelings:
    - action: keep
      regex: ^(metric1|metric2|...)$
      sourceLabels:
      - __name__
    port: metrics
Aggregate Prometheus
Another Prometheus instance in the garden namespace (called "aggregate Prometheus") stores pre-aggregated data from the cache Prometheus and shoot Prometheus. An ingress exposes this Prometheus instance allowing it to be scraped from another cluster. For more details, continue reading here.
Typically, this is not necessary, but in case an extension wants to extend the configuration for this aggregate Prometheus, they can create the prometheus-operator's custom resources and label them with prometheus=aggregate, for example:
apiVersion: monitoring.coreos.com/v1
kind: ServiceMonitor
metadata:
  labels:
    prometheus: aggregate
  name: aggregate-my-component
  namespace: garden
spec:
  selector:
    matchLabels:
      app: my-component
  endpoints:
  - metricRelabelings:
    - action: keep
      regex: ^(metric1|metric2|...)$
      sourceLabels:
      - __name__
    port: metrics
Plutono
A Plutono instance is deployed by gardenlet into the seed cluster's garden namespace for visualizing monitoring metrics and logs via dashboards. In order to provide custom dashboards, create a ConfigMap in the garden namespace labelled with dashboard.monitoring.gardener.cloud/seed=true that contains the respective JSON documents, for example:
apiVersion: v1
kind: ConfigMap
metadata:
  labels:
    dashboard.monitoring.gardener.cloud/seed: "true"
  name: extension-foo-my-custom-dashboard
  namespace: garden
data:
  my-custom-dashboard.json: <dashboard-JSON-document>
Shoot Cluster
Shoot Prometheus
The shoot-specific metrics are then made available to operators and users in the shoot Plutono, using the shoot Prometheus as data source.
Extension controllers might deploy components as part of their reconciliation next to the shoot's control plane. Examples for this would be a cloud-controller-manager or CSI controller deployments. Extensions that want to have their managed control plane components integrated with monitoring can contribute their per-shoot configuration for scraping Prometheus metrics, Alertmanager alerts or Plutono dashboards.
Extensions Monitoring Integration
In case an extension wants to extend the configuration for the shoot Prometheus, they can create the prometheus-operator's custom resources and label them with prometheus=shoot.
ServiceMonitor
When the component runs in the seed cluster (e.g., as part of the shoot control plane), ServiceMonitor resources should be used:
apiVersion: monitoring.coreos.com/v1
kind: ServiceMonitor
metadata:
  labels:
    prometheus: shoot
  name: shoot-my-controlplane-component
  namespace: shoot--foo--bar
spec:
  selector:
    matchLabels:
      app: my-component
  endpoints:
  - metricRelabelings:
    - action: keep
      regex: ^(metric1|metric2|...)$
      sourceLabels:
      - __name__
    port: metrics
In case HTTPS scheme is used, the CA certificate should be provided like this:
spec:
  scheme: HTTPS
  tlsConfig:
    ca:
      secret:
        name: <name-of-ca-bundle-secret>
        key: bundle.crt
In case the component requires credentials when contacting its metrics endpoint, provide them like this:
spec:
  authorization:
    credentials:
      name: <name-of-secret-containing-credentials>
      key: <data-keyin-secret>
If the component delegates authorization to the kube-apiserver of the shoot cluster, you can use the shoot-access-prometheus-shoot secret:
spec:
  authorization:
    credentials:
      name: shoot-access-prometheus-shoot
      key: token
  # in case the component's server certificate is signed by the cluster CA:
  scheme: HTTPS
  tlsConfig:
    ca:
      secret:
        name: <name-of-ca-bundle-secret>
key: bundle.crtScrapeConfigs
If the component runs in the shoot cluster itself, metrics are scraped via the kube-apiserver proxy. In this case, Prometheus needs to authenticate itself with the API server. This can be done like this:
apiVersion: monitoring.coreos.com/v1alpha1
kind: ScrapeConfig
metadata:
  labels:
    prometheus: shoot
  name: shoot-my-cluster-component
  namespace: shoot--foo--bar
spec:
  authorization:
    credentials:
      name: shoot-access-prometheus-shoot
      key: token
  scheme: HTTPS
  tlsConfig:
    ca:
      secret:
        name: <name-of-ca-bundle-secret>
        key: bundle.crt
  kubernetesSDConfigs:
  - apiServer: https://kube-apiserver
    authorization:
      credentials:
        name: shoot-access-prometheus-shoot
        key: token
    followRedirects: true
    namespaces:
      names:
      - kube-system
    role: endpoints
    tlsConfig:
      ca:
        secret:
          name: <name-of-ca-bundle-secret>
          key: bundle.crt
      cert: {}
  metricRelabelings:
  - sourceLabels:
    - __name__
    action: keep
    regex: ^(metric1|metric2)$
  - sourceLabels:
    - namespace
    action: keep
    regex: kube-system
  relabelings:
  - action: replace
    replacement: my-cluster-component
    targetLabel: job
  - sourceLabels: [__meta_kubernetes_service_name, __meta_kubernetes_pod_container_port_name]
    separator: ;
    regex: my-component-service;metrics
    replacement: $1
    action: keep
  - sourceLabels: [__meta_kubernetes_endpoint_node_name]
    separator: ;
    regex: (.*)
    targetLabel: node
    replacement: $1
    action: replace
  - sourceLabels: [__meta_kubernetes_pod_name]
    separator: ;
    regex: (.*)
    targetLabel: pod
    replacement: $1
    action: replace
  - targetLabel: __address__
    replacement: kube-apiserver:443
  - sourceLabels: [__meta_kubernetes_pod_name, __meta_kubernetes_pod_container_port_number]
    separator: ;
    regex: (.+);(.+)
    targetLabel: __metrics_path__
    replacement: /api/v1/namespaces/kube-system/pods/${1}:${2}/proxy/metrics
    action: replace
TIP
Developers can make use of the pkg/component/observability/monitoring/prometheus/shoot.ClusterComponentScrapeConfigSpec function in order to generate a ScrapeConfig like above.
PrometheusRule
Similar to ServiceMonitors, PrometheusRules can be created with the prometheus=shoot label:
apiVersion: monitoring.coreos.com/v1
kind: PrometheusRule
metadata:
  labels:
    prometheus: shoot
  name: shoot-my-component
  namespace: shoot--foo--bar
spec:
  groups:
  - name: my.rules
    rules:
    # ...
Plutono Dashboards
A Plutono instance is deployed by gardenlet into the shoot cluster's namespace for visualizing monitoring metrics and logs via dashboards. In order to provide custom dashboards, create a ConfigMap in the shoot cluster's namespace labelled with dashboard.monitoring.gardener.cloud/shoot=true that contains the respective JSON documents, for example:
apiVersion: v1
kind: ConfigMap
metadata:
  labels:
    dashboard.monitoring.gardener.cloud/shoot: "true"
  name: extension-foo-my-custom-dashboard
  namespace: shoot--project--name
data:
  my-custom-dashboard.json: <dashboard-JSON-document>
Logging
In Kubernetes clusters, container logs are non-persistent and do not survive stopped and destroyed containers. Gardener addresses this problem for the components hosted in a seed cluster by introducing its own managed logging solution. It is integrated with the Gardener monitoring stack to have all troubleshooting context in one place.
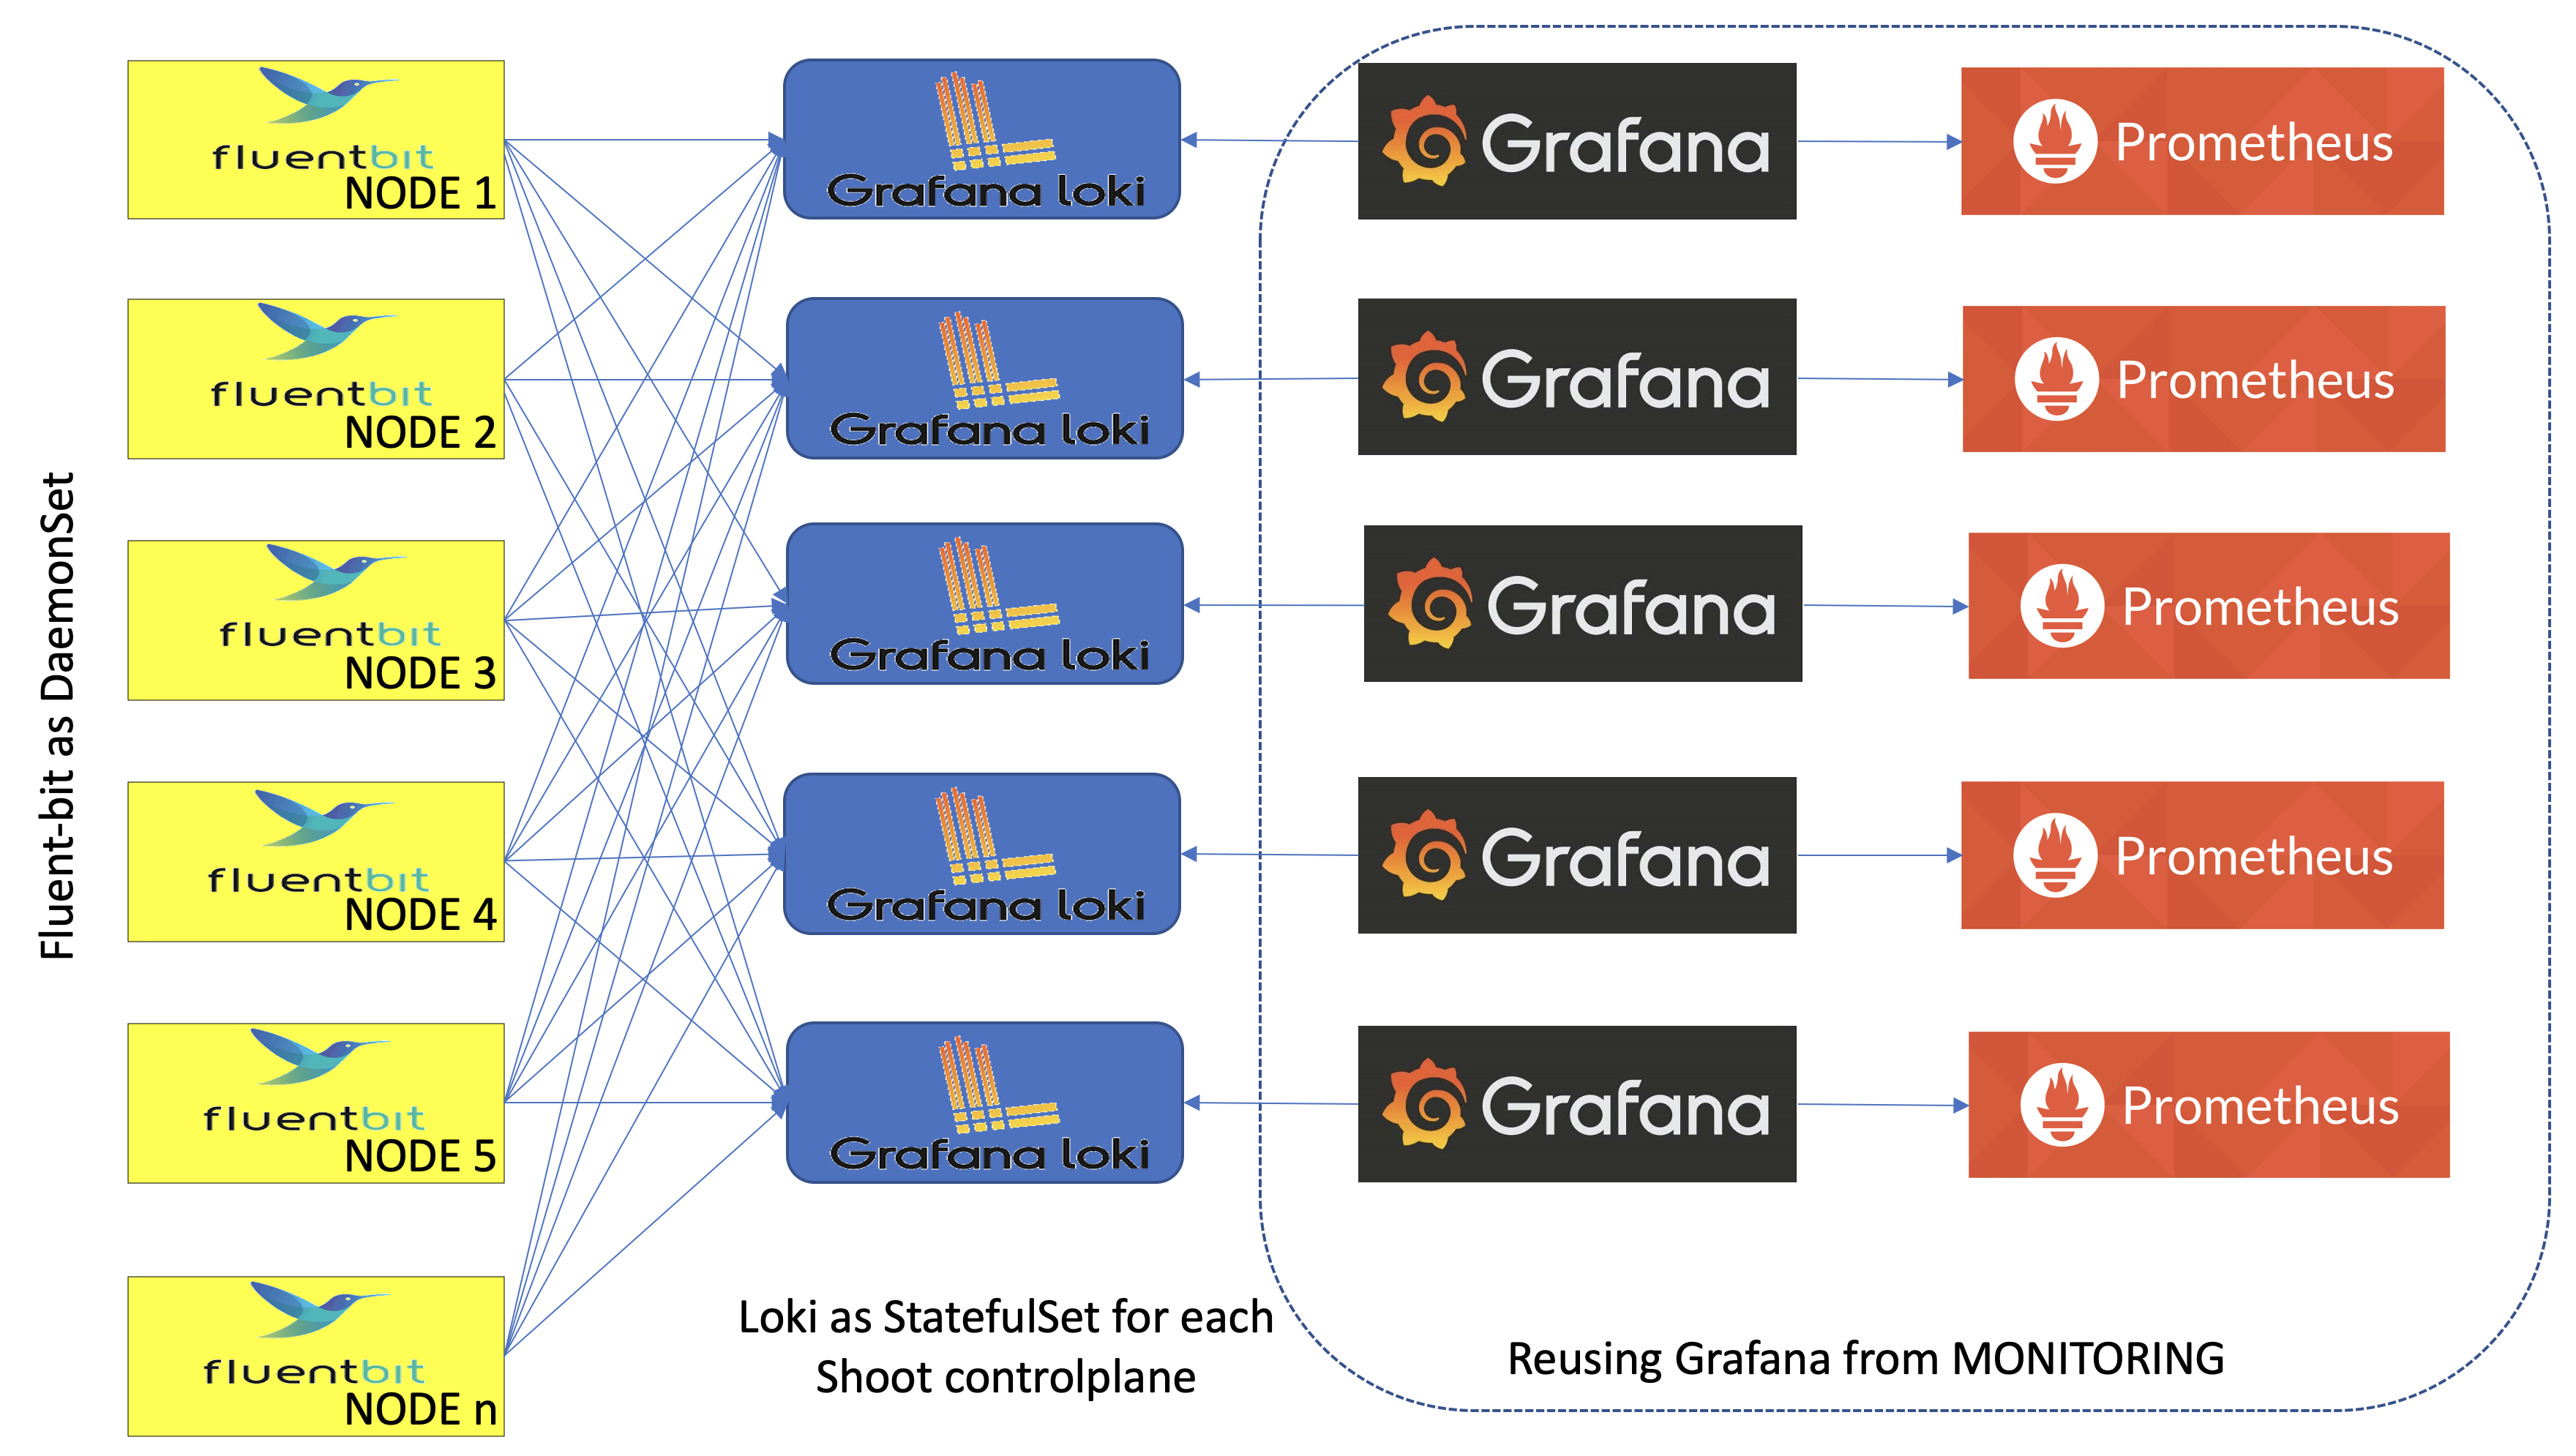
Gardener logging consists of components in three roles - log collectors and forwarders, log persistency and exploration/consumption interfaces. All of them live in the seed clusters in multiple instances:
- Logs are persisted by Vali instances deployed as StatefulSets - one per shoot namespace, if the logging is enabled in the
gardenletconfiguration (logging.enabled) and the shoot purpose is nottesting, and one in thegardennamespace. The shoot instances store logs from the control plane components hosted there. ThegardenVali instance is responsible for logs from the rest of the seed namespaces -kube-system,garden,extension-*, and others. - Fluent-bit DaemonSets deployed by the fluent-operator on each seed node collect logs from it. A custom plugin takes care to distribute the collected log messages to the Vali instances that they are intended for. This allows to fetch the logs once for the whole cluster, and to distribute them afterwards.
- Plutono is the UI component used to explore monitoring and log data together for easier troubleshooting and in context. Plutono instances are configured to use the corresponding Vali instances, sharing the same namespace as data providers. There is one Plutono Deployment in the
gardennamespace and one Deployment per shoot namespace (exposed to the end users and to the operators).
Logs can be produced from various sources, such as containers or systemd, and in different formats. The fluent-bit design supports configurable data pipeline to address that problem. Gardener provides such configuration for logs produced by all its core managed components as ClusterFilters and ClusterParsers . Extensions can contribute their own, specific configurations as fluent-operator custom resources too. See for example the logging configuration for the Gardener AWS provider extension.
Fluent-bit Log Parsers and Filters
To integrate with Gardener logging, extensions can and should specify how fluent-bit will handle the logs produced by the managed components that they contribute to Gardener. Normally, that would require to configure a parser for the specific logging format, if none of the available is applicable, and a filter defining how to apply it. For a complete reference for the configuration options, refer to fluent-bit's documentation.
To contribute its own configuration to the fluent-bit agents data pipelines, an extension must deploy a fluent-operator custom resource labeled with fluentbit.gardener/type: seed in the seed cluster.
Note: Take care to provide the correct data pipeline elements in the corresponding fields and not to mix them.
Example: Logging configuration for provider-specific cloud-controller-manager deployed into shoot namespaces that reuses the kube-apiserver-parser defined in logging.go to parse the component logs:
apiVersion: fluentbit.fluent.io/v1alpha2
kind: ClusterFilter
metadata:
  labels:
    fluentbit.gardener/type: "seed"
  name: cloud-controller-manager-aws-cloud-controller-manager
spec:
  filters:
  - parser:
      keyName: log
      parser: kube-apiserver-parser
      reserveData: true
  match: kubernetes.*cloud-controller-manager*aws-cloud-controller-manager*
Further details how to define parsers and use them with examples can be found in the following guide.
Plutono
The two types of Plutono instances found in a seed cluster are configured to expose logs of different origin in their dashboards:
- Garden Plutono dashboards expose logs from non-shoot namespaces of the seed clusters
- Shoot Plutono dashboards expose logs from the shoot cluster namespace where they belong
- Kube Apiserver
- Kube Controller Manager
- Kube Scheduler
- Cluster Autoscaler
- VPA components
- Kubernetes Pods
If the type of logs exposed in the Plutono instances needs to be changed, it is necessary to update the corresponding instance dashboard configurations.
Tips
- Be careful to create
ClusterFiltersandClusterParserswith unique names because they are not namespaced. We usepod_namefor filters with one container andpod_name--container_namefor pods with multiple containers. - Be careful to match exactly the log names that you need for a particular parser in your filters configuration. The regular expression you will supply will match names in the form
kubernetes.pod_name.<metadata>.container_name. If there are extensions with the same container and pod names, they will all match the same parser in a filter. That may be a desired effect, if they all share the same log format. But it will be a problem if they don't. To solve it, either the pod or container names must be unique, and the regular expression in the filter has to match that unique pattern. A recommended approach is to prefix containers with the extension name and tune the regular expression to match it. For example, usingmyextension-containeras container name and a regular expressionkubernetes.mypod.*myextension-containerwill guarantee match of the right log name. Make sure that the regular expression does not match more than you expect. For example,kubernetes.systemd.*systemd.*will match bothsystemd-serviceandsystemd-monitor-service. You will want to be as specific as possible. - It's a good idea to put the logging configuration into the Helm chart that also deploys the extension controller, while the monitoring configuration can be part of the Helm chart/deployment routine that deploys the component managed by the controller.
- For monitoring to work in the Gardener context, scrape targets need to be labelled appropriately, see
NetworkPolicys In Garden, Seed, Shoot Clusters for details.