This is the multi-page printable view of this section. Click here to print.

Return to the regular view of this page.

Monitoring

Monitoring

Roles of the different Prometheus instances
monitoring

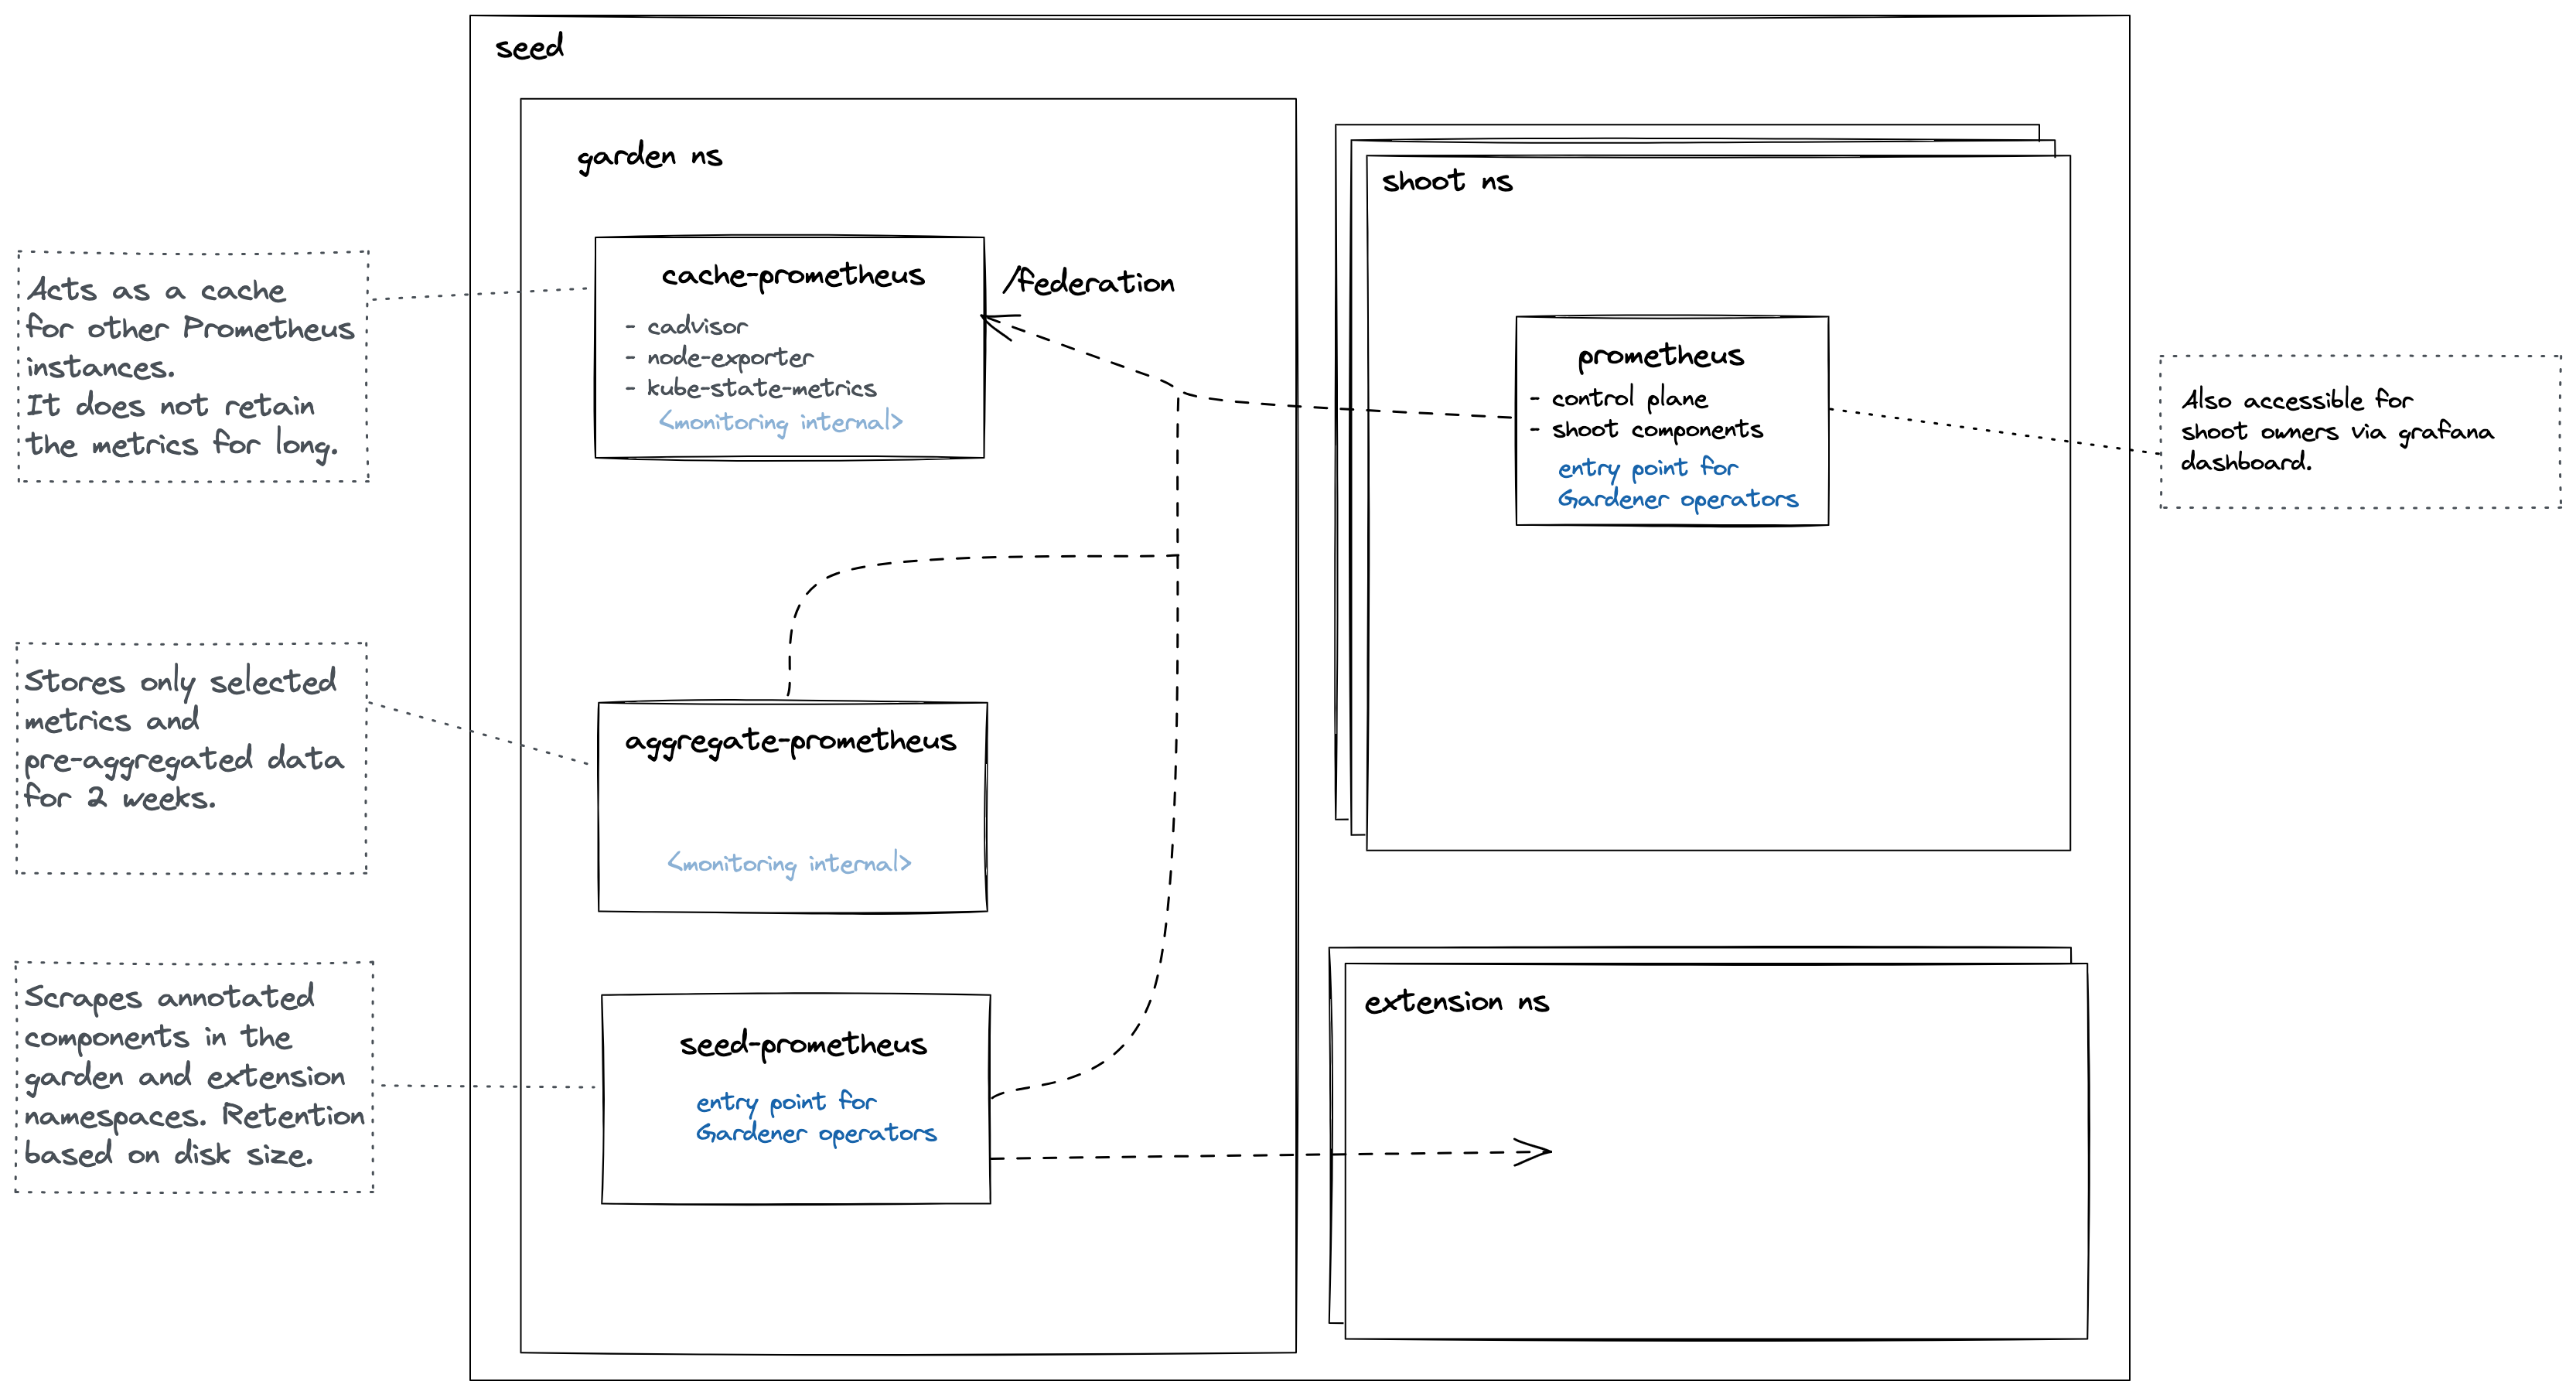
Cache Prometheus

Deployed in the garden namespace. Important scrape targets:

  • cadvisor
  • node-exporter
  • kube-state-metrics

Purpose: Act as a reverse proxy that supports server-side filtering, which is not supported by Prometheus exporters but by federation. Metrics in this Prometheus are kept for a short amount of time (~1 day) since other Prometheus instances are expected to federate from it and move metrics over. For example, the shoot Prometheus queries this Prometheus to retrieve metrics corresponding to the shoot’s control plane. This way, we achieve isolation so that shoot owners are only able to query metrics for their shoots. Please note Prometheus does not support isolation features. Another example is if another Prometheus needs access to cadvisor metrics, which does not support server-side filtering, so it will query this Prometheus instead of the cadvisor. This strategy also reduces load on the kubelets and API Server.

Note some of these Prometheus’ metrics have high cardinality (e.g., metrics related to all shoots managed by the seed). Some of these are aggregated with recording rules. These pre-aggregated metrics are scraped by the aggregate Prometheus.

This Prometheus is not used for alerting.

Aggregate Prometheus

Deployed in the garden namespace. Important scrape targets:

  • other Prometheus instances
  • logging components

Purpose: Store pre-aggregated data from the cache Prometheus and shoot Prometheus. An ingress exposes this Prometheus allowing it to be scraped from another cluster. Such pre-aggregated data is also used for alerting.

Seed Prometheus

Deployed in the garden namespace. Important scrape targets:

  • pods in extension namespaces annotated with:
prometheus.io/scrape=true
prometheus.io/port=<port>
prometheus.io/name=<name>
  • cadvisor metrics from pods in the garden and extension namespaces

The job name label will be applied to all metrics from that service.

Purpose: Entrypoint for operators when debugging issues with extensions or other garden components.

This Prometheus is not used for alerting.

Shoot Prometheus

Deployed in the shoot control plane namespace. Important scrape targets:

  • control plane components
  • shoot nodes (node-exporter)
  • blackbox-exporter used to measure connectivity

Purpose: Monitor all relevant components belonging to a shoot cluster managed by Gardener. Shoot owners can view the metrics in Plutono dashboards and receive alerts based on these metrics. For alerting internals refer to this document.

Collect all shoot Prometheus with remote write

An optional collection of all shoot Prometheus metrics to a central Prometheus (or cortex) instance is possible with the monitoring.shoot setting in GardenletConfiguration:

monitoring:
  shoot:
    remoteWrite:
      url: https://remoteWriteUrl # remote write URL
      keep:# metrics that should be forwarded to the external write endpoint. If empty all metrics get forwarded
      - kube_pod_container_info
    externalLabels: # add additional labels to metrics to identify it on the central instance
      additional: label

If basic auth is needed it can be set via secret in garden namespace (Gardener API Server). Example secret

Disable Gardener Monitoring

If you wish to disable metric collection for every shoot and roll your own then you can simply set.

monitoring:
  shoot:
    enabled: false

1 - Alerting

Alerting

Gardener uses Prometheus to gather metrics from each component. A Prometheus is deployed in each shoot control plane (on the seed) which is responsible for gathering control plane and cluster metrics. Prometheus can be configured to fire alerts based on these metrics and send them to an Alertmanager. The Alertmanager is responsible for sending the alerts to users and operators. This document describes how to setup alerting for:

Alerting for Users

To receive email alerts as a user, set the following values in the shoot spec:

spec:
  monitoring:
    alerting:
      emailReceivers:
      - john.doe@example.com

emailReceivers is a list of emails that will receive alerts if something is wrong with the shoot cluster.

Alerting for Operators

Currently, Gardener supports two options for alerting:

Email Alerting

Gardener provides the option to deploy an Alertmanager into each seed. This Alertmanager is responsible for sending out alerts to operators for each shoot cluster in the seed. Only email alerts are supported by the Alertmanager managed by Gardener. This is configurable by setting the Gardener controller manager configuration values alerting. See Gardener Configuration and Usage on how to configure the Gardener’s SMTP secret. If the values are set, a secret with the label gardener.cloud/role: alerting will be created in the garden namespace of the garden cluster. This secret will be used by each Alertmanager in each seed.

External Alertmanager

The Alertmanager supports different kinds of alerting configurations. The Alertmanager provided by Gardener only supports email alerts. If email is not sufficient, then alerts can be sent to an external Alertmanager. Prometheus will send alerts to a URL and then alerts will be handled by the external Alertmanager. This external Alertmanager is operated and configured by the operator (i.e. Gardener does not configure or deploy this Alertmanager). To configure sending alerts to an external Alertmanager, create a secret in the virtual garden cluster in the garden namespace with the label: gardener.cloud/role: alerting. This secret needs to contain a URL to the external Alertmanager and information regarding authentication. Supported authentication types are:

  • No Authentication (none)
  • Basic Authentication (basic)
  • Mutual TLS (certificate)

Remote Alertmanager Examples

Note: The url value cannot be prepended with http or https.

# No Authentication
apiVersion: v1
kind: Secret
metadata:
  labels:
    gardener.cloud/role: alerting
  name: alerting-auth
  namespace: garden
data:
  # No Authentication
  auth_type: base64(none)
  url: base64(external.alertmanager.foo)

  # Basic Auth
  auth_type: base64(basic)
  url: base64(extenal.alertmanager.foo)
  username: base64(admin)
  password: base64(password)

  # Mutual TLS
  auth_type: base64(certificate)
  url: base64(external.alertmanager.foo)
  ca.crt: base64(ca)
  tls.crt: base64(certificate)
  tls.key: base64(key)
  insecure_skip_verify: base64(false)

  # Email Alerts (internal alertmanager)
  auth_type: base64(smtp)
  auth_identity: base64(internal.alertmanager.auth_identity)
  auth_password: base64(internal.alertmanager.auth_password)
  auth_username: base64(internal.alertmanager.auth_username)
  from: base64(internal.alertmanager.from)
  smarthost: base64(internal.alertmanager.smarthost)
  to: base64(internal.alertmanager.to)
type: Opaque

Configuring Your External Alertmanager

Please refer to the Alertmanager documentation on how to configure an Alertmanager.

We recommend you use at least the following inhibition rules in your Alertmanager configuration to prevent excessive alerts:

inhibit_rules:
# Apply inhibition if the alert name is the same.
- source_match:
    severity: critical
  target_match:
    severity: warning
  equal: ['alertname', 'service', 'cluster']

# Stop all alerts for type=shoot if there are VPN problems.
- source_match:
    service: vpn
  target_match_re:
    type: shoot
  equal: ['type', 'cluster']

# Stop warning and critical alerts if there is a blocker
- source_match:
    severity: blocker
  target_match_re:
    severity: ^(critical|warning)$
  equal: ['cluster']

# If the API server is down inhibit no worker nodes alert. No worker nodes depends on kube-state-metrics which depends on the API server.
- source_match:
    service: kube-apiserver
  target_match_re:
    service: nodes
  equal: ['cluster']

# If API server is down inhibit kube-state-metrics alerts.
- source_match:
    service: kube-apiserver
  target_match_re:
    severity: info
  equal: ['cluster']

# No Worker nodes depends on kube-state-metrics. Inhibit no worker nodes if kube-state-metrics is down.
- source_match:
    service: kube-state-metrics-shoot
  target_match_re:
    service: nodes
  equal: ['cluster']

Below is a graph visualizing the inhibition rules:

inhibitionGraph

2 - Connectivity

Connectivity

Shoot Connectivity

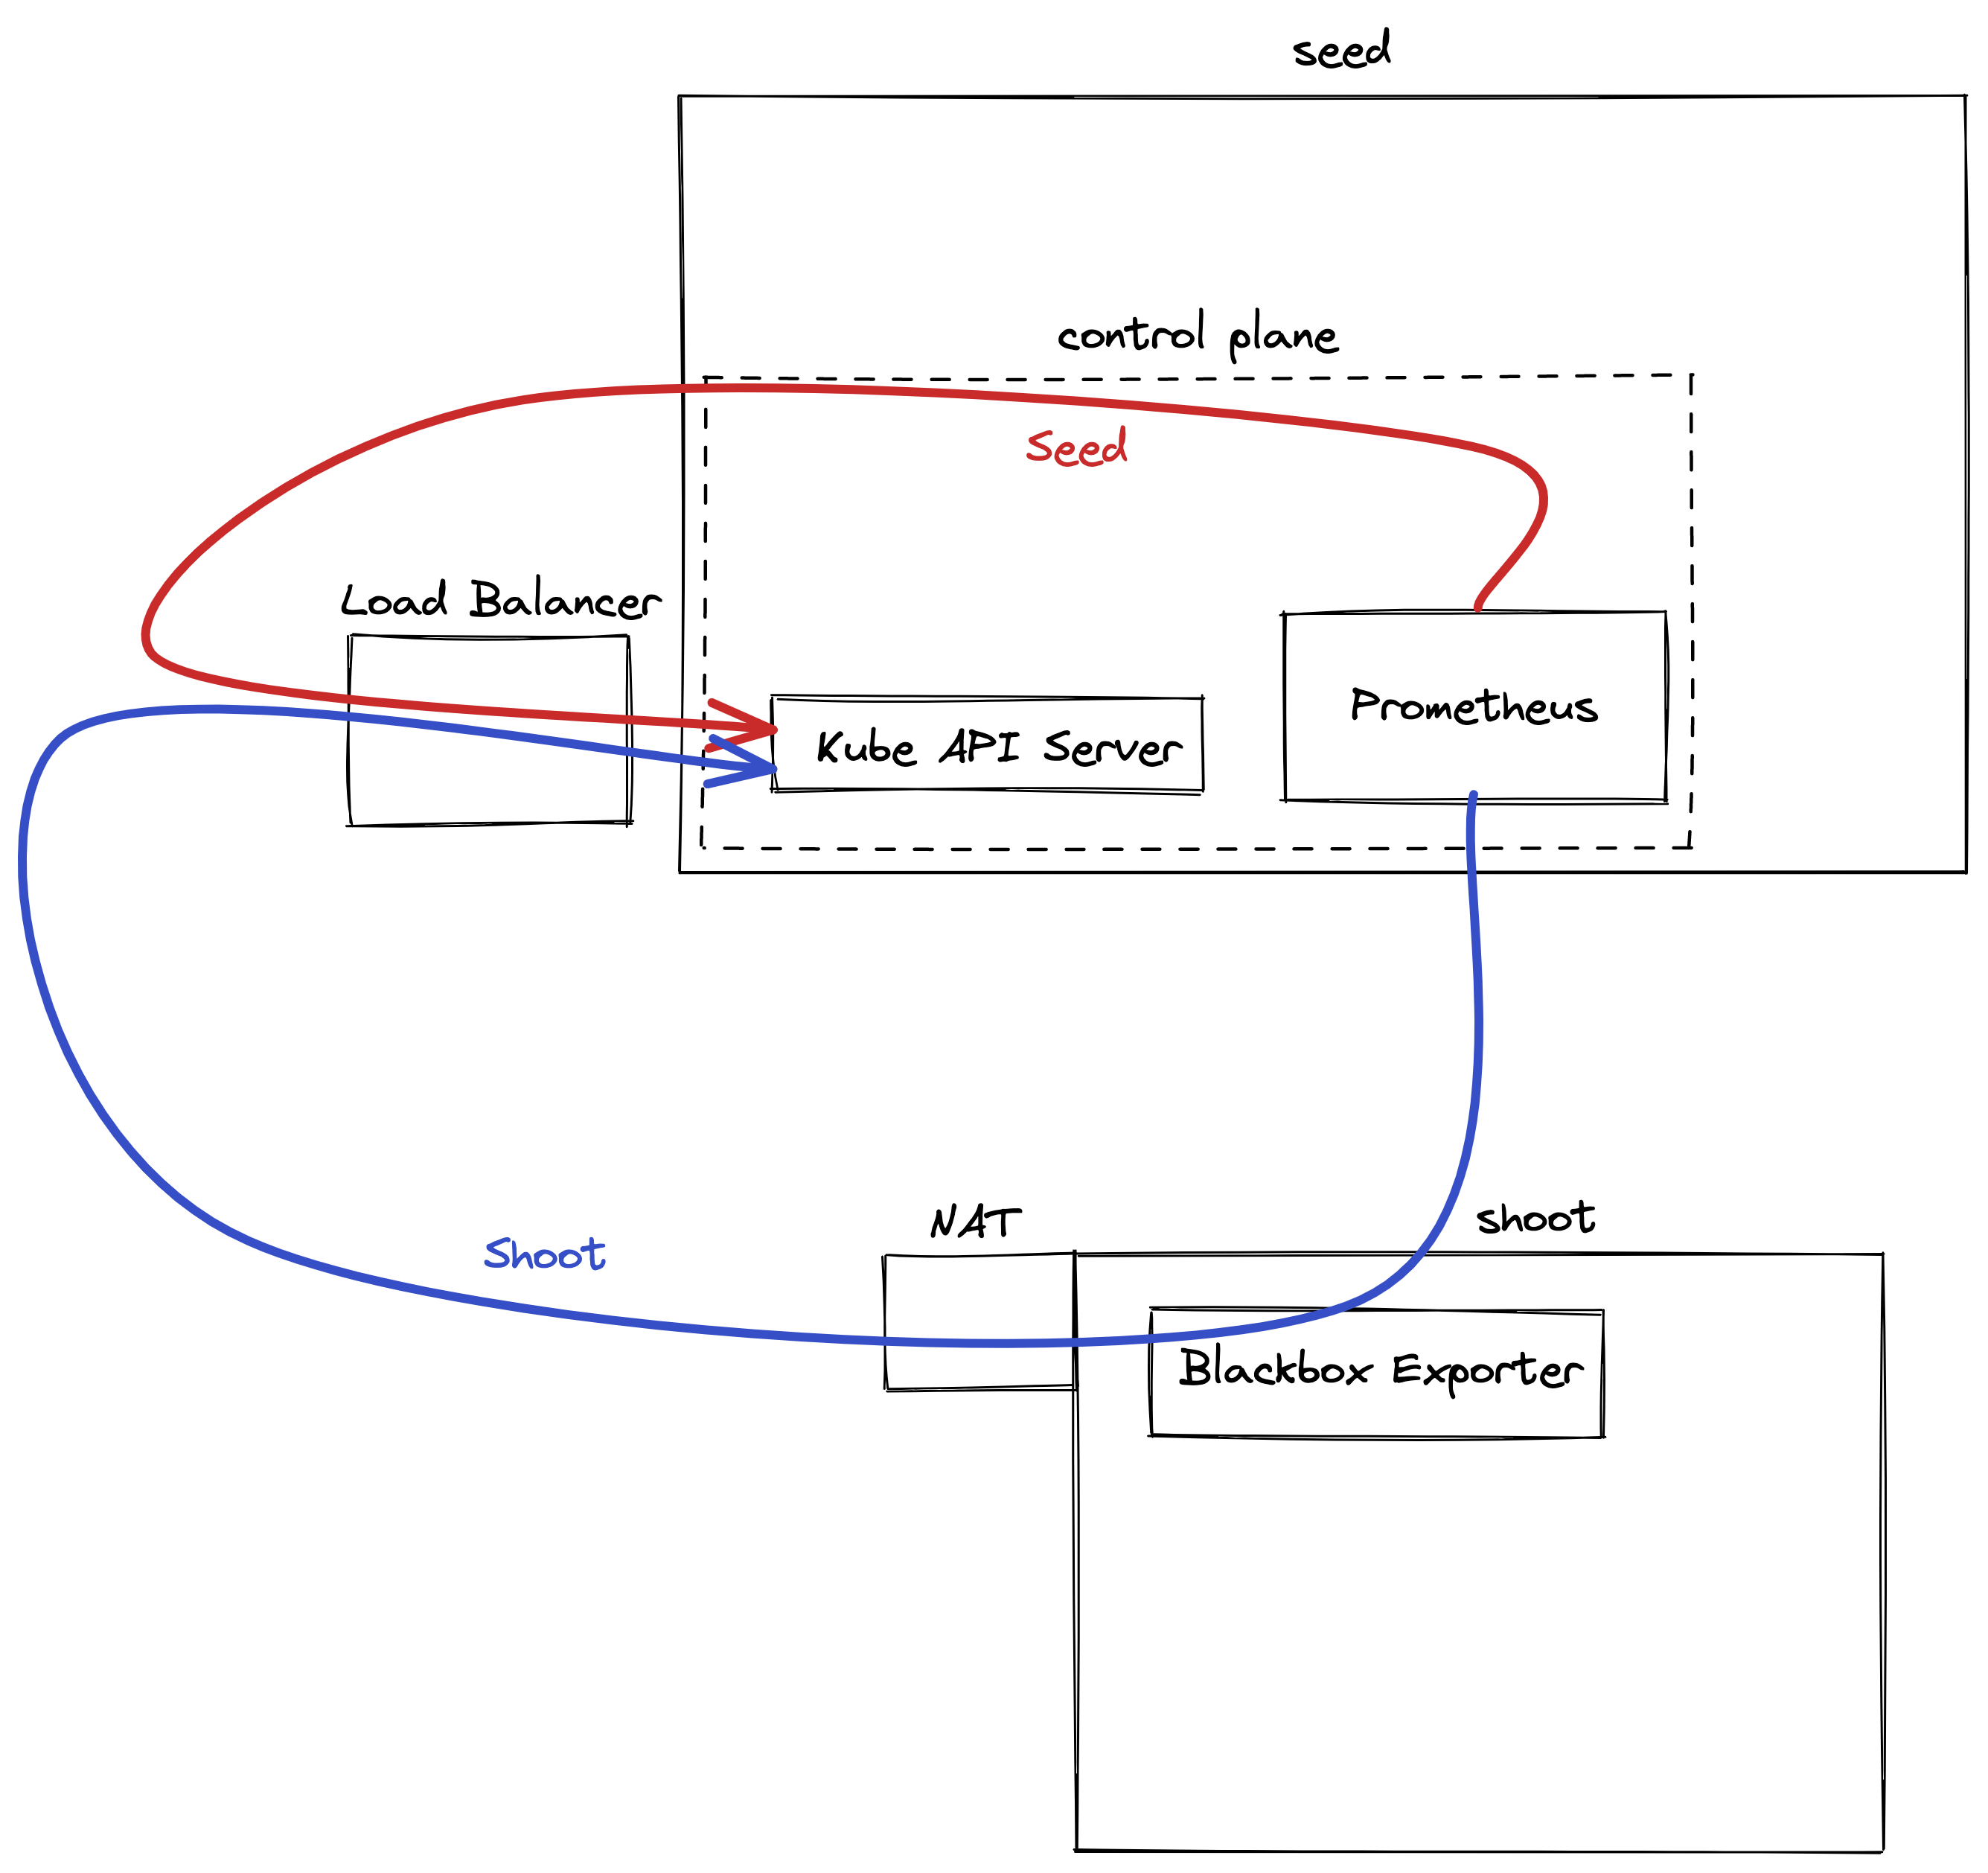
We measure the connectivity from the shoot to the API Server. This is done via the blackbox exporter which is deployed in the shoot’s kube-system namespace. Prometheus will scrape the blackbox exporter and then the exporter will try to access the API Server. Metrics are exposed if the connection was successful or not. This can be seen in the Kubernetes Control Plane Status dashboard under the API Server Connectivity panel. The shoot line represents the connectivity from the shoot.

image

Seed Connectivity

In addition to the shoot connectivity, we also measure the seed connectivity. This means trying to reach the API Server from the seed via the external fully qualified domain name of the API server. The connectivity is also displayed in the above panel as the seed line. Both seed and shoot connectivity are shown below.

image

3 - Profiling

Profiling Gardener Components

Similar to Kubernetes, Gardener components support profiling using standard Go tools for analyzing CPU and memory usage by different code sections and more. This document shows how to enable and use profiling handlers with Gardener components.

Enabling profiling handlers and the ports on which they are exposed differs between components. However, once the handlers are enabled, they provide profiles via the same HTTP endpoint paths, from which you can retrieve them via curl/wget or directly using go tool pprof. (You might need to use kubectl port-forward in order to access HTTP endpoints of Gardener components running in clusters.)

For example (gardener-controller-manager):

$ curl http://localhost:2718/debug/pprof/heap > /tmp/heap-controller-manager
$ go tool pprof /tmp/heap-controller-manager
Type: inuse_space
Time: Sep 3, 2021 at 10:05am (CEST)
Entering interactive mode (type "help" for commands, "o" for options)
(pprof)

or

$ go tool pprof http://localhost:2718/debug/pprof/heap
Fetching profile over HTTP from http://localhost:2718/debug/pprof/heap
Saved profile in /Users/timebertt/pprof/pprof.alloc_objects.alloc_space.inuse_objects.inuse_space.008.pb.gz
Type: inuse_space
Time: Sep 3, 2021 at 10:05am (CEST)
Entering interactive mode (type "help" for commands, "o" for options)
(pprof)

gardener-apiserver

gardener-apiserver provides the same flags as kube-apiserver for enabling profiling handlers (enabled by default):

--contention-profiling    Enable lock contention profiling, if profiling is enabled
--profiling               Enable profiling via web interface host:port/debug/pprof/ (default true)

The handlers are served on the same port as the API endpoints (configured via --secure-port). This means that you will also have to authenticate against the API server according to the configured authentication and authorization policy.

gardener-{admission-controller,controller-manager,scheduler,resource-manager}, gardenlet

gardener-controller-manager, gardener-admission-controller, gardener-scheduler, gardener-resource-manager and gardenlet also allow enabling profiling handlers via their respective component configs (currently disabled by default). Here is an example for the gardener-admission-controller’s configuration and how to enable it (it looks similar for the other components):

apiVersion: admissioncontroller.config.gardener.cloud/v1alpha1
kind: AdmissionControllerConfiguration
# ...
server:
  metrics:
    port: 2723
debugging:
  enableProfiling: true
  enableContentionProfiling: true

However, the handlers are served on the same port as configured in server.metrics.port via HTTP.

For example (gardener-admission-controller):

$ curl http://localhost:2723/debug/pprof/heap > /tmp/heap
$ go tool pprof /tmp/heap