This is the multi-page printable view of this section. Click here to print.
Applications
1 - Shoot Pod Autoscaling Best Practices
Introduction
There are two types of pod autoscaling in Kubernetes: Horizontal Pod Autoscaling (HPA) and Vertical Pod Autoscaling (VPA). HPA (implemented as part of the kube-controller-manager) scales the number of pod replicas, while VPA (implemented as independent community project) adjusts the CPU and memory requests for the pods. Both types of autoscaling aim to optimize resource usage/costs and maintain the performance and (high) availability of applications running on Kubernetes.
Horizontal Pod Autoscaling (HPA)
Horizontal Pod Autoscaling involves increasing or decreasing the number of pod replicas in a deployment, replica set, stateful set, or anything really with a scale subresource that manages pods. HPA adjusts the number of replicas based on specified metrics, such as CPU or memory average utilization (usage divided by requests; most common) or average value (usage; less common). When the demand on your application increases, HPA automatically scales out the number of pods to meet the demand. Conversely, when the demand decreases, it scales in the number of pods to reduce resource usage.
HPA targets (mostly stateless) applications where adding more instances of the application can linearly increase the ability to handle additional load. It is very useful for applications that experience variable traffic patterns, as it allows for real-time scaling without the need for manual intervention.
Note
HPA continuously monitors the metrics of the targeted pods and adjusts the number of replicas based on the observed metrics. It operates solely on the current metrics when it calculates the averages across all pods, meaning it reacts to the immediate resource usage without considering past trends or patterns. Also, all pods are treated equally based on the average metrics. This could potentially lead to situations where some pods are under high load while others are underutilized. Therefore, particular care must be applied to (fair) load-balancing (connection vs. request vs. actual resource load balancing are crucial).
A Few Words on the Cluster-Proportional (Horizontal) Autoscaler (CPA) and the Cluster-Proportional Vertical Autoscaler (CPVA)
Besides HPA and VPA, CPA and CPVA are further options for scaling horizontally or vertically (neither is deployed by Gardener and must be deployed by the user). Unlike HPA and VPA, CPA and CPVA do not monitor the actual pod metrics, but scale solely on the number of nodes or CPU cores in the cluster. While this approach may be helpful and sufficient in a few rare cases, it is often a risky and crude scaling scheme that we do not recommend. More often than not, cluster-proportional scaling results in either under- or over-reserving your resources.
Vertical Pod Autoscaling (VPA)
Vertical Pod Autoscaling, on the other hand, focuses on adjusting the CPU and memory resources allocated to the pods themselves. Instead of changing the number of replicas, VPA tweaks the resource requests (and limits, but only proportionally, if configured) for the pods in a deployment, replica set, stateful set, daemon set, or anything really with a scale subresource that manages pods. This means that each pod can be given more, or fewer resources as needed.
VPA is very useful for optimizing the resource requests of pods that have dynamic resource needs over time. It does so by mutating pod requests (unfortunately, not in-place). Therefore, in order to apply new recommendations, pods that are “out of bounds” (i.e. below a configured/computed lower or above a configured/computed upper recommendation percentile) will be evicted proactively, but also pods that are “within bounds” may be evicted after a grace period. The corresponding higher-level replication controller will then recreate a new pod that VPA will then mutate to set the currently recommended requests (and proportional limits, if configured).
Note
VPA continuously monitors all targeted pods and calculates recommendations based on their usage (one recommendation for the entire target). This calculation is influenced by configurable percentiles, with a greater emphasis on recent usage data and a gradual decrease (=decay) in the relevance of older data. However, this means, that VPA doesn’t take into account individual needs of single pods - eventually, all pods will receive the same recommendation, which may lead to considerable resource waste. Ideally, VPA would update pods in-place depending on their individual needs, but that’s (individual recommendations) not in its design, even if in-place updates get implemented, which may be years away for VPA based on current activity on the component.
Selecting the Appropriate Autoscaler
Before deciding on an autoscaling strategy, it’s important to understand the characteristics of your application:
- Interruptibility: Most importantly, if the clients of your workload are too sensitive to disruptions/cannot cope well with terminating pods, then maybe neither HPA nor VPA is an option (both, HPA and VPA cause pods and connections to be terminated, though VPA even more frequently). Clients must retry on disruptions, which is a reasonable ask in a highly dynamic (and self-healing) environment such as Kubernetes, but this is often not respected (or expected) by your clients (they may not know or care you run the workload in a Kubernetes cluster and have different expectations to the stability of the workload unless you communicated those through SLIs/SLOs/SLAs).
- Statelessness: Is your application stateless or stateful? Stateless applications are typically better candidates for HPA as they can be easily scaled out by adding more replicas without worrying about maintaining state.
- Traffic Patterns: Does your application experience variable traffic? If so, HPA can help manage these fluctuations by adjusting the number of replicas to handle the load.
- Resource Usage: Does your application’s resource usage change over time? VPA can adjust the CPU and memory reservations dynamically, which is beneficial for applications with non-uniform resource requirements.
- Scalability: Can your application handle increased load by scaling vertically (more resources per pod) or does it require horizontal scaling (more pod instances)?
HPA is the right choice if:
- Your application is stateless and can handle increased load by adding more instances.
- You experience short-term fluctuations in traffic that require quick scaling responses.
- You want to maintain a specific performance metric, such as requests per second per pod.
VPA is the right choice if:
- Your application’s resource requirements change over time, and you want to optimize resource usage without manual intervention.
- You want to avoid the complexity of managing resource requests for each pod, especially when they run code where it’s impossible for you to suggest static requests.
In essence:
- For applications that can handle increased load by simply adding more replicas, HPA should be used to handle short-term fluctuations in load by scaling the number of replicas.
- For applications that require more resources per pod to handle additional work, VPA should be used to adjust the resource allocation for longer-term trends in resource usage.
Consequently, if both cases apply (VPA often applies), HPA and VPA can also be combined. However, combining both, especially on the same metrics (CPU and memory), requires understanding and care to avoid conflicts and ensure that the autoscaling actions do not interfere with and rather complement each other. For more details, see Combining HPA and VPA.
Horizontal Pod Autoscaler (HPA)
HPA operates by monitoring resource metrics for all pods in a target. It computes the desired number of replicas from the current average metrics and the desired user-defined metrics as follows:
desiredReplicas = ceil[currentReplicas * (currentMetricValue / desiredMetricValue)]
HPA checks the metrics at regular intervals, which can be configured by the user. Several types of metrics are supported (classical resource metrics like CPU and memory, but also custom and external metrics like requests per second or queue length can be configured, if available). If a scaling event is necessary, HPA adjusts the replica count for the targeted resource.
Defining an HPA Resource
To configure HPA, you need to create an HPA resource in your cluster. This resource specifies the target to scale, the metrics to be used for scaling decisions, and the desired thresholds. Here’s an example of an HPA configuration:
apiVersion: autoscaling/v2
kind: HorizontalPodAutoscaler
metadata:
  name: foo-hpa
spec:
  scaleTargetRef:
    apiVersion: apps/v1
    kind: Deployment
    name: foo-deployment
  minReplicas: 1
  maxReplicas: 10
  metrics:
  - type: Resource
    resource:
      name: cpu
      target:
        type: AverageValue
        averageValue: 2
  - type: Resource
    resource:
      name: memory
      target:
        type: AverageValue
        averageValue: 8G
  behavior:
    scaleUp:
      stabilizationWindowSeconds: 30
      policies:
      - type: Percent
        value: 100
        periodSeconds: 60
    scaleDown:
      stabilizationWindowSeconds: 1800
      policies:
      - type: Pods
        value: 1
        periodSeconds: 300
In this example, HPA is configured to scale foo-deployment based on pod average CPU and memory usage. It will maintain an average CPU and memory usage (not utilization, which is usage divided by requests!) across all replicas of 2 CPUs and 8G or lower with as few replicas as possible. The number of replicas will be scaled between a minimum of 1 and a maximum of 10 based on this target.
Since a while, you can also configure the autoscaling based on the resource usage of individual containers, not only on the resource usage of the entire pod. All you need to do is to switch the type from Resource to ContainerResource and specify the container name.
In the official documentation ([1] and [2]) you will find examples with average utilization (averageUtilization), not average usage (averageValue), but this is not particularly helpful, especially if you plan to combine HPA together with VPA on the same metrics (generally discouraged in the documentation). If you want to safely combine both on the same metrics, you should scale on average usage (averageValue) as shown above. For more details, see Combining HPA and VPA.
Finally, the behavior section influences how fast you scale up and down. Most of the time (depends on your workload), you like to scale out faster than you scale in. In this example, the configuration will trigger a scale-out only after observing the need to scale out for 30s (stabilizationWindowSeconds) and will then only scale out at most 100% (value + type) of the current number of replicas every 60s (periodSeconds). The configuration will trigger a scale-in only after observing the need to scale in for 1800s (stabilizationWindowSeconds) and will then only scale in at most 1 pod (value + type) every 300s (periodSeconds). As you can see, scale-out happens quicker than scale-in in this example.
HPA (actually KCM) Options
HPA is a function of the kube-controller-manager (KCM).
You can read up the full KCM options online and set most of them conveniently in your Gardener shoot cluster spec:
downscaleStabilization(default 5m): HPA will scale out whenever the formula (in accordance with the behavior section, if present in the HPA resource) yields a higher replica count, but it won’t scale in just as eagerly. This option lets you define a trailing time window that HPA must check and only if the recommended replica count is consistently lower throughout the entire time window, HPA will scale in (in accordance with the behavior section, if present in the HPA resource). If at any point in time in that trailing time window the recommended replica count isn’t lower, scale-in won’t happen. This setting is just a default, if nothing is defined in the behavior section of an HPA resource. The default for the upscale stabilization is 0s and it cannot be set via a KCM option (downscale stabilization was historically more important than upscale stabilization and when later the behavior sections were added to the HPA resources, upscale stabilization remained missing from the KCM options).tolerance(default +/-10%): HPA will not scale out or in if the desired replica count is (mathematically as a float) near the actual replica count (see source code for details), which is a form of hysteresis to avoid replica flapping around a threshold.
There are a few more configurable options of lesser interest:
syncPeriod(default 15s): How often HPA retrieves the pods and metrics respectively how often it recomputes and sets the desired replica count.cpuInitializationPeriod(default 30s) andinitialReadinessDelay(default 5m): Both settings only affect whether or not CPU metrics are considered for scaling decisions. They can be easily misinterpreted as the official docs are somewhat hard to read (see source code for details, which is more readable, if you ignore the comments). Normally, you have little reason to modify them, but here is what they do:cpuInitializationPeriod: Defines a grace period after a pod starts during which HPA won’t consider CPU metrics of the pod for scaling if the pod is either not ready or it is ready, but a given CPU metric is older than the last state transition (to ready). This is to ignore CPU metrics that predate the current readiness while still in initialization to not make scaling decisions based on potentially misleading data. If the pod is ready and a CPU metric was collected after it became ready, it is considered also within this grace period.initialReadinessDelay: Defines another grace period after a pod starts during which HPA won’t consider CPU metrics of the pod for scaling if the pod is not ready and it became not ready within this grace period (the docs/comments want to check whether the pod was ever ready, but the code only checks whether the pod condition last transition time to not ready happened within that grace period which it could have from being ready or simply unknown before). This is to ignore not (ever have been) ready pods while still in initialization to not make scaling decisions based on potentially misleading data. If the pod is ready, it is considered also within this grace period.
So, regardless of the values of these settings, if a pod is reporting ready and it has a CPU metric from the time after it became ready, that pod and its metric will be considered. This holds true even if the pod becomes ready very early into its initialization. These settings cannot be used to “black-out” pods for a certain duration before being considered for scaling decisions. Instead, if it is your goal to ignore a potentially resource-intensive initialization phase that could wrongly lead to further scale-out, you would need to configure your pods to not report as ready until that resource-intensive initialization phase is over.
Considerations When Using HPA
- Selection of metrics: Besides CPU and memory, HPA can also target custom or external metrics. Pick those (in addition or exclusively), if you guarantee certain SLOs in your SLAs.
- Targeting usage or utilization: HPA supports usage (absolute) and utilization (relative). Utilization is often preferred in simple examples, but usage is more precise and versatile.
- Compatibility with VPA: Care must be taken when using HPA in conjunction with VPA, as they can potentially interfere with each other’s scaling decisions.
Vertical Pod Autoscaler (VPA)
VPA operates by monitoring resource metrics for all pods in a target. It computes a resource requests recommendation from the historic and current resource metrics. VPA checks the metrics at regular intervals, which can be configured by the user. Only CPU and memory are supported. If VPA detects that a pod’s resource allocation is too high or too low, it may evict pods (if within the permitted disruption budget), which will trigger the creation of a new pod by the corresponding higher-level replication controller, which will then be mutated by VPA to match resource requests recommendation. This happens in three different components that work together:
- VPA Recommender: The Recommender observes the historic and current resource metrics of pods and generates recommendations based on this data.
- VPA Updater: The Updater component checks the recommendations from the Recommender and decides whether any pod’s resource requests need to be updated. If an update is needed, the Updater will evict the pod.
- VPA Admission Controller: When a pod is (re-)created, the Admission Controller modifies the pod’s resource requests based on the recommendations from the Recommender. This ensures that the pod starts with the optimal amount of resources.
Since VPA doesn’t support in-place updates, pods will be evicted. You will want to control voluntary evictions by means of Pod Disruption Budgets (PDBs). Please make yourself familiar with those and use them.
Note
PDBs will not always work as expected and can also get in your way, e.g. if the PDB is violated or would be violated, it may possibly block evictions that would actually help your workload, e.g. to get a pod out of an
OOMKilledCrashLoopBackoff(if the PDB is or would be violated, not even unhealthy pods would be evicted as they could theoretically become healthy again, which VPA doesn’t know). In order to overcome this issue, it is now possible (alpha since Kubernetesv1.26in combination with the feature gatePDBUnhealthyPodEvictionPolicyon the API server, beta and enabled by default since Kubernetesv1.27) to configure the so-called unhealthy pod eviction policy. The default is stillIfHealthyBudgetas a change in default would have changed the behavior (as described above), but you can now also setAlwaysAllowat the PDB (spec.unhealthyPodEvictionPolicy). For more information, please check out this discussion, the PR and this document and balance the pros and cons for yourself. In short, the newAlwaysAllowoption is probably the better choice in most of the cases whileIfHealthyBudgetis useful only if you have frequent temporary transitions or for special cases where you have already implemented controllers that depend on the old behavior.
Defining a VPA Resource
To configure VPA, you need to create a VPA resource in your cluster. This resource specifies the target to scale, the metrics to be used for scaling decisions, and the policies for resource updates. Here’s an example of an VPA configuration:
apiVersion: autoscaling.k8s.io/v1
kind: VerticalPodAutoscaler
metadata:
  name: foo-vpa
spec:
  targetRef:
    apiVersion: "apps/v1"
    kind:       Deployment
    name:       foo-deployment
  updatePolicy:
    updateMode: "Auto"
  resourcePolicy:
    containerPolicies:
    - containerName: foo-container
      controlledValues: RequestsOnly
      minAllowed:
        cpu: 50m
        memory: 200M
      maxAllowed:
        cpu: 4
        memory: 16G
In this example, VPA is configured to scale foo-deployment requests (RequestsOnly) from 50m cores (minAllowed) up to 4 cores (maxAllowed) and 200M memory (minAllowed) up to 16G memory (maxAllowed) automatically (updateMode). VPA doesn’t support in-place updates, so in updateMode Auto it will evict pods under certain conditions and then mutate the requests (and possibly limits if you omit controlledValues or set it to RequestsAndLimits, which is the default) of upcoming new pods.
Multiple update modes exist. They influence eviction and mutation. The most important ones are:
Off: In this mode, recommendations are computed, but never applied. This mode is useful, if you want to learn more about your workload or if you have a custom controller that depends on VPA’s recommendations but shall act instead of VPA.Initial: In this mode, recommendations are computed and applied, but pods are never proactively evicted to enforce new recommendations over time. This mode is useful, if you want to control pod evictions yourself (similar to theStatefulSetupdateStrategyOnDelete) or your workload is sensitive to evictions, e.g. some brownfield singleton application or a daemon set pod that is critical for the node.Auto(default): In this mode, recommendations are computed, applied, and pods are even proactively evicted to enforce new recommendations over time. This applies recommendations continuously without you having to worry too much.
As mentioned, controlledValues influences whether only requests or requests and limits are scaled:
RequestsOnly: Updates only requests and doesn’t change limits. Useful if you have defined absolute limits (unrelated to the requests).RequestsAndLimits(default): Updates requests and proportionally scales limits along with the requests. Useful if you have defined relative limits (related to the requests). In this case, the gap between requests and limits should be either zero for QoSGuaranteedor small for QoSBurstableto avoid useless (way beyond the threshold of unhealthy behavior) or absurd (larger than node capacity) values.
VPA doesn’t offer many more settings that can be tuned per VPA resource than you see above (different than HPA’s behavior section). However, there is one more that isn’t shown above, which allows to scale only up or only down (evictionRequirements[].changeRequirement), in case you need that, e.g. to provide resources when needed, but avoid disruptions otherwise.
VPA Options
VPA is an independent community project that consists of a recommender (computing target recommendations and bounds), an updater (evicting pods that are out of recommendation bounds), and an admission controller (mutating webhook applying the target recommendation to newly created pods). As such, they have independent options.
VPA Recommender Options
You can read up the full VPA recommender options online and set some of them conveniently in your Gardener shoot cluster spec:
recommendationMarginFraction(default 15%): Safety margin that will be added to the recommended requests.targetCPUPercentile(default 90%): CPU usage percentile that will be targeted with the CPU recommendation (i.e. recommendation will “fit” e.g. 90% of the observed CPU usages). This setting is relevant for balancing your requests reservations vs. your costs. If you want to reduce costs, you can reduce this value (higher risk because of potential under-reservation, but lower costs), because CPU is compressible, but then VPA may lack the necessary signals for scale-up as throttling on an otherwise fully utilized node will go unnoticed by VPA. If you want to err on the safe side, you can increase this value, but you will then target more and more a worst case scenario, quickly (maybe even exponentially) increasing the costs.targetMemoryPercentile(default 90%): Memory usage percentile that will be targeted with the memory recommendation (i.e. recommendation will “fit” e.g. 90% of the observed memory usages). This setting is relevant for balancing your requests reservations vs. your costs. If you want to reduce costs, you can reduce this value (higher risk because of potential under-reservation, but lower costs), because OOMs will trigger bump-ups, but those will disrupt the workload. If you want to err on the safe side, you can increase this value, but you will then target more and more a worst case scenario, quickly (maybe even exponentially) increasing the costs.
There are a few more configurable options of lesser interest:
recommenderInterval(default 1m): How often VPA retrieves the pods and metrics respectively how often it recomputes the recommendations and bounds.
There are many more options that you can only configure if you deploy your own VPA and which we will not discuss here, but you can check them out here.
Note
Due to an implementation detail (smallest bucket size), VPA cannot create recommendations below 10m cores and 10M memory even if
minAllowedis lower.
VPA Updater Options
You can read up the full VPA updater options online and set some of them conveniently in your Gardener shoot cluster spec:
evictAfterOOMThreshold(default 10m): Pods where at least one container OOMs within this time period since its start will be actively evicted, which will implicitly apply the new target recommendation that will have been bumped up afterOOMKill. Please note, the kubelet may evict pods even before an OOM, but only ifkube-reservedis underrun, i.e. node-level resources are running low. In these cases, eviction will happen first by pod priority and second by how much the usage overruns the requests.evictionTolerance(default 50%): Defines a threshold below which no further eligible pod will be evited anymore, i.e. limits how many eligible pods may be in eviction in parallel (but at least 1). The threshold is computed as follows:running - evicted > replicas - tolerance. Example: 10 replicas, 9 running, 8 eligible for eviction, 20% tolerance with 10 replicas which amounts to 2 pods, and no pod evicted in this round yet, then9 - 0 > 10 - 2is true and a pod would be evicted, but the next one would be in violation as9 - 1 = 10 - 2and no further pod would be evicted anymore in this round.evictionRateBurst(default 1): Defines how many eligible pods may be evicted in one go.evictionRateLimit(default disabled): Defines how many eligible pods may be evicted per second (a value of 0 or -1 disables the rate limiting).
In general, avoid modifying these eviction settings unless you have good reasons and try to rely on Pod Disruption Budgets (PDBs) instead. However, PDBs are not available for daemon sets.
There are a few more configurable options of lesser interest:
updaterInterval(default 1m): How often VPA evicts the pods.
There are many more options that you can only configure if you deploy your own VPA and which we will not discuss here, but you can check them out here.
Considerations When Using VPA
- Initial Resource Estimates: VPA requires historical resource usage data to base its recommendations on. Until they kick in, your initial resource requests apply and should be sensible.
- Pod Disruption: When VPA adjusts the resources for a pod, it may need to “recreate” the pod, which can cause temporary disruptions. This should be taken into account.
- Compatibility with HPA: Care must be taken when using VPA in conjunction with HPA, as they can potentially interfere with each other’s scaling decisions.
Combining HPA and VPA
HPA and VPA serve different purposes and operate on different axes of scaling. HPA increases or decreases the number of pod replicas based on metrics like CPU or memory usage, effectively scaling the application out or in. VPA, on the other hand, adjusts the CPU and memory reservations of individual pods, scaling the application up or down.
When used together, these autoscalers can provide both horizontal and vertical scaling. However, they can also conflict with each other if used on the same metrics (e.g. both on CPU or both on memory). In particular, if VPA adjusts the requests, the utilization, i.e. the ratio between usage and requests, will approach 100% (for various reasons not exactly right, but for this consideration, close enough), which may trigger HPA to scale out, if it’s configured to scale on utilization below 100% (often seen in simple examples), which will spread the load across more pods, which may trigger VPA again to adjust the requests to match the new pod usages.
This is a feedback loop and it stems from HPA’s method of calculating the desired number of replicas, which is:
desiredReplicas = ceil[currentReplicas * (currentMetricValue / desiredMetricValue)]
If desiredMetricValue is utilization and VPA adjusts the requests, which changes the utilization, this may inadvertently trigger HPA and create said feedback loop. On the other hand, if desiredMetricValue is usage and VPA adjusts the requests now, this will have no impact on HPA anymore (HPA will always influence VPA, but we can control whether VPA influences HPA).
Therefore, to safely combine HPA and VPA, consider the following strategies:
- Configure HPA and VPA on different metrics: One way to avoid conflicts is to use HPA and VPA based on different metrics. For instance, you could configure HPA to scale based on requests per seconds (or another representative custom/external metric) and VPA to adjust CPU and memory requests. This way, each autoscaler operates independently based on its specific metric(s).
- Configure HPA to scale on usage, not utilization, when used with VPA: Another way to avoid conflicts is to use HPA not on average utilization (
averageUtilization), but instead on average usage (averageValue) as replicas driver, which is an absolute metric (requests don’t affect usage). This way, you can combine both autoscalers even on the same metrics.
Pod Autoscaling and Cluster Autoscaler
Autoscaling within Kubernetes can be implemented at different levels: pod autoscaling (HPA and VPA) and cluster autoscaling (CA). While pod autoscaling adjusts the number of pod replicas or their resource reservations, cluster autoscaling focuses on the number of nodes in the cluster, so that your pods can be hosted. If your workload isn’t static and especially if you make use of pod autoscaling, it only works if you have sufficient node capacity available. The most effective way to do that, without running a worst-case number of nodes, is to configure burstable worker pools in your shoot spec, i.e. define a true minimum node count and a worst-case maximum node count and leave the node autoscaling to Gardener that internally uses the Cluster Autoscaler to provision and deprovision nodes as needed.
Cluster Autoscaler automatically adjusts the number of nodes by adding or removing nodes based on the demands of the workloads and the available resources. It interacts with the cloud provider’s APIs to provision or deprovision nodes as needed. Cluster Autoscaler monitors the utilization of nodes and the scheduling of pods. If it detects that pods cannot be scheduled due to a lack of resources, it will trigger the addition of new nodes to the cluster. Conversely, if nodes are underutilized for some time and their pods can be placed on other nodes, it will remove those nodes to reduce costs and improve resource efficiency.
Best Practices:
- Resource Buffering: Maintain a buffer of resources to accommodate temporary spikes in demand without waiting for node provisioning. This can be done by deploying pods with low priority that can be preempted when real workloads require resources. This helps in faster pod scheduling and avoids delays in scaling out or up.
- Pod Disruption Budgets (PDBs): Use PDBs to ensure that during scale-down events, the availability of applications is maintained as the Cluster Autoscaler will not voluntarily evict a pod if a PDB would be violated.
Interesting CA Options
CA can be configured in your Gardener shoot cluster spec globally and also in parts per worker pool:
- Can only be configured globally:
expander(default least-waste): Defines the “expander” algorithm to use during scale-up, see FAQ.scaleDownDelayAfterAdd(default 1h): Defines how long after scaling up a node, a node may be scaled down.scaleDownDelayAfterFailure(default 3m): Defines how long after scaling down a node failed, scaling down will be resumed.scaleDownDelayAfterDelete(default 0s): Defines how long after scaling down a node, another node may be scaled down.
- Can be configured globally and also overwritten individually per worker pool:
scaleDownUtilizationThreshold(default 50%): Defines the threshold below which a node becomes eligible for scaling down.scaleDownUnneededTime(default 30m): Defines the trailing time window the node must be consistently below a certain utilization threshold before it can finally be scaled down.
There are many more options that you can only configure if you deploy your own CA and which we will not discuss here, but you can check them out here.
Importance of Monitoring
Monitoring is a critical component of autoscaling for several reasons:
- Performance Insights: It provides insights into how well your autoscaling strategy is meeting the performance requirements of your applications.
- Resource Utilization: It helps you understand resource utilization patterns, enabling you to optimize resource allocation and reduce waste.
- Cost Management: It allows you to track the cost implications of scaling actions, helping you to maintain control over your cloud spending.
- Troubleshooting: It enables you to quickly identify and address issues with autoscaling, such as unexpected scaling behavior or resource bottlenecks.
To effectively monitor autoscaling, you should leverage the following tools and metrics:
- Kubernetes Metrics Server: Collects resource metrics from kubelets and provides them to HPA and VPA for autoscaling decisions (automatically provided by Gardener).
- Prometheus: An open-source monitoring system that can collect and store custom metrics, providing a rich dataset for autoscaling decisions.
- Grafana/Plutono: A visualization tool that integrates with Prometheus to create dashboards for monitoring autoscaling metrics and events.
- Cloud Provider Tools: Most cloud providers offer native monitoring solutions that can be used to track the performance and costs associated with autoscaling.
Key metrics to monitor include:
- CPU and Memory Utilization: Track the resource utilization of your pods and nodes to understand how they correlate with scaling events.
- Pod Count: Monitor the number of pod replicas over time to see how HPA is responding to changes in load.
- Scaling Events: Keep an eye on scaling events triggered by HPA and VPA to ensure they align with expected behavior.
- Application Performance Metrics: Track application-specific metrics such as response times, error rates, and throughput.
Based on the insights gained from monitoring, you may need to adjust your autoscaling configurations:
- Refine Thresholds: If you notice frequent scaling actions or periods of underutilization or overutilization, adjust the thresholds used by HPA and VPA to better match the workload patterns.
- Update Policies: Modify VPA update policies if you observe that the current settings are causing too much or too little pod disruption.
- Custom Metrics: If using custom metrics, ensure they accurately reflect the load on your application and adjust them if they do not.
- Scaling Limits: Review and adjust the minimum and maximum scaling limits to prevent over-scaling or under-scaling based on the capacity of your cluster and the criticality of your applications.
Quality of Service (QoS)
A few words on the quality of service for pods. Basically, there are 3 classes of QoS and they influence the eviction of pods when kube-reserved is underrun, i.e. node-level resources are running low:
BestEffort, i.e. pods where no container has CPU or memory requests or limits: Avoid them unless you have really good reasons. The kube-scheduler will place them just anywhere according to its policy, e.g.balancedorbin-packing, but whatever resources these pods consume, may bring other pods into trouble or even the kubelet and the container runtime itself, if it happens very suddenly.Burstable, i.e. pods where at least one container has CPU or memory requests and at least one has no limits or limits that don’t match the requests: Prefer them unless you have really good reasons for the other QoS classes. Always specify proper requests or use VPA to recommend those. This helps the kube-scheduler to make the right scheduling decisions. Not having limits will additionally provide upward resource flexibility, if the node is not under pressure.Guaranteed, i.e. pods where all containers have CPU and memory requests and equal limits: Avoid them unless you really know the limits or throttling/killing is intended. While “Guaranteed” sounds like something “positive” in the English language, this class comes with the downside, that pods will be actively CPU-throttled and will actively go OOM, even if the node is not under pressure and has excess capacity left. Worse, if containers in the pod are under VPA, their CPU requests/limits will often not be scaled up as CPU throttling will go unnoticed by VPA.
Summary
- As a rule of thumb, always set CPU and memory requests (or let VPA do that) and always avoid CPU and memory limits.
- CPU limits aren’t helpful on an under-utilized node (=may result in needless outages) and even suppress the signals for VPA to act. On a nearly or fully utilized node, CPU limits are practically irrelevant as only the requests matter, which are translated into CPU shares that provide a fair use of the CPU anyway (see CFS).
Therefore, if you do not know the healthy range, do not set CPU limits. If you as author of the source code know its healthy range, set them to the upper threshold of that healthy range (everything above, from your knowledge of that code, is definitely an unbound busy loop or similar, which is the main reason for CPU limits, besides batch jobs where throttling is acceptable or even desired). - Memory limits may be more useful, but suffer a similar, though not as negative downside. As with CPU limits, memory limits aren’t helpful on an under-utilized node (=may result in needless outages), but different than CPU limits, they result in an OOM, which triggers VPA to provide more memory suddenly (modifies the currently computed recommendations by a configurable factor, defaulting to +20%, see docs).
Therefore, if you do not know the healthy range, do not set memory limits. If you as author of the source code know its healthy range, set them to the upper threshold of that healthy range (everything above, from your knowledge of that code, is definitely an unbound memory leak or similar, which is the main reason for memory limits)
- CPU limits aren’t helpful on an under-utilized node (=may result in needless outages) and even suppress the signals for VPA to act. On a nearly or fully utilized node, CPU limits are practically irrelevant as only the requests matter, which are translated into CPU shares that provide a fair use of the CPU anyway (see CFS).
- Horizontal Pod Autoscaling (HPA): Use for pods that support horizontal scaling. Prefer scaling on usage, not utilization, as this is more predictable (not dependent on a second variable, namely the current requests) and conflict-free with vertical pod autoscaling (VPA).
- As a rule of thumb, set the initial replicas to the 5th percentile of the actually observed replica count in production. Since HPA reacts fast, this is not as critical, but may help reduce initial load on the control plane early after deployment. However, be cautious when you update the higher-level resource not to inadvertently reset the current HPA-controlled replica count (very easy to make mistake that can lead to catastrophic loss of pods). HPA modifies the replica count directly in the spec and you do not want to overwrite that. Even if it reacts fast, it is not instant (not via a mutating webhook as VPA operates) and the damage may already be done.
- As for minimum and maximum, let your high availability requirements determine the minimum and your theoretical maximum load determine the maximum, flanked with alerts to detect erroneous run-away out-scaling or the actual nearing of your practical maximum load, so that you can intervene.
- Vertical Pod Autoscaling (VPA): Use for containers that have a significant usage (e.g. any container above 50m CPU or 100M memory) and a significant usage spread over time (by more than 2x), i.e. ignore small (e.g. side-cars) or static (e.g. Java statically allocated heap) containers, but otherwise use it to provide the resources needed on the one hand and keep the costs in check on the other hand.
- As a rule of thumb, set the initial requests to the 5th percentile of the actually observed CPU resp. memory usage in production. Since VPA may need some time at first to respond and evict pods, this is especially critical early after deployment. The lower bound, below which pods will be immediately evicted, converges much faster than the upper bound, above which pods will be immediately evicted, but it isn’t instant, e.g. after 5 minutes the lower bound is just at 60% of the computed lower bound; after 12 hours the upper bound is still at 300% of the computed upper bound (see code). Unlike with HPA, you don’t need to be as cautious when updating the higher-level resource in the case of VPA. As long as VPA’s mutating webhook (VPA Admission Controller) is operational (which also the VPA Updater checks before evicting pods), it’s generally safe to update the higher-level resource. However, if it’s not up and running, any new pods that are spawned (e.g. as a consequence of a rolling update of the higher-level resource or for any other reason) will not be mutated. Instead, they will receive whatever requests are currently configured at the higher-level resource, which can lead to catastrophic resource under-reservation. Gardener deploys the VPA Admission Controller in HA - if unhealthy, it is reported under the
ControlPlaneHealthyshoot status condition. - As a rule of thumb, for a container under VPA always specify initial resource requests for the resources which are controlled by VPA (the
controlledResourcesfield; by default both cpu and memory are controlled). vpa-updater evicts immediately if a container does not specify initial resource requests for a resource controlled by VPA (see code). - As a rule of thumb, for a container under VPA do not set initial requests less than VPA’s
minAllowedor vpa-recommender’s Pod minimum recommendation (10mand10Mi). In Gardener, vpa-recommender is configured to run with--pod-recommendation-min-cpu-millicores=10and--pod-recommendation-min-memory-mb=10(see code). These values are synced with the smallest histogram bucket sizes -10mand10M(see VPA Recommender Options). Note that the--pod-recommendation-min-memory-mbflag is in mebibytes, not megabytes (see code). If a Pod has a container under VPA with resource requests less than the VPA’sminAllowedor10mand10Mi, the Pod will be evicted immediately. The reason is that the VPA’s lower bound recommendation is set tominAllowedor10mand10Mi. vpa-updater evicts immediately if the container’s resource requests are “out of bounds” (in this particular case - less than the lower bound). - If you have defined absolute limits (unrelated to the requests), configure VPA to only scale the requests or else it will proportionally scale the limits as well, which can easily become useless (way beyond the threshold of unhealthy behavior) or absurd (larger than node capacity):
If you have defined relative limits (related to the requests), the default policy to scale the limits proportionally with the requests is fine, but the gap between requests and limits must be zero for QoSspec: resourcePolicy: containerPolicies: - controlledValues: RequestsOnly ...Guaranteedand should best be small for QoSBurstableto avoid useless or absurd limits either, e.g. prefer limits being 5 to at most 20% larger than requests as opposed to being 100% larger or more. - As a rule of thumb, set
minAllowedto the highest observed VPA recommendation (usually during the initialization phase or during any periodical activity) for an otherwise practically idle container, so that you avoid needless trashing (e.g. resource usage calms down over time and recommendations drop consecutively until eviction, which will then lead again to initialization or later periodical activity and higher recommendations and new evictions).
⚠️ You may want to provide higherminAllowedvalues, if you observe that up-scaling takes too long for CPU or memory for a too large percentile of your workload. This will get you out of the danger zone of too few resources for too many pods at the expense of providing too many resources for a few pods. Memory may react faster than CPU, because CPU throttling is not visible and memory gets aided by OOM bump-up incidents, but still, if you observe that up-scaling takes too long, you may want to increaseminAllowedaccordingly. - As a rule of thumb, set
maxAllowedto your theoretical maximum load, flanked with alerts to detect erroneous run-away usage or the actual nearing of your practical maximum load, so that you can intervene. However, VPA can easily recommend requests larger than what is allocatable on a node, so you must either ensure large enough nodes (Gardener can scale up from zero, in case you like to define a low-priority worker pool with more resources for very large pods) and/or cap VPA’s target recommendations usingmaxAllowedat the node allocatable remainder (after daemon set pods) of the largest eligible machine type (may result in under-provisioning resources for a pod). Use your monitoring and check maximum pod usage to decide about the maximum machine type.
Recommendations in a Box
| Container | When to use | Value |
|---|---|---|
| Requests | - Set them (recommended) unless: - Do not set requests for QoS BestEffort; useful only if pod can be evicted as often as needed and pod can pick up where it left off without any penalty | Set requests to 95th percentile (w/o VPA) of the actually observed CPU resp. memory usage in production resp. 5th percentile (w/ VPA) (see below) |
| Limits | - Avoid them (recommended) unless: - Set limits for QoS Guaranteed; useful only if pod has strictly static resource requirements- Set CPU limits if you want to throttle CPU usage for containers that can be throttled w/o any other disadvantage than processing time (never do that when time-critical operations like leases are involved) - Set limits if you know the healthy range and want to shield against unbound busy loops, unbound memory leaks, or similar | If you really can (otherwise not), set limits to healthy theoretical max load |
| Scaler | When to use | Initial | Minimum | Maximum |
|---|---|---|---|---|
| HPA | Use for pods that support horizontal scaling | Set initial replicas to 5th percentile of the actually observed replica count in production (prefer scaling on usage, not utilization) and make sure to never overwrite it later when controlled by HPA | Set minReplicas to 0 (requires feature gate and custom/external metrics), to 1 (regular HPA minimum), or whatever the high availability requirements of the workload demand | Set maxReplicas to healthy theoretical max load |
| VPA | Use for containers that have a significant usage (>50m/100M) and a significant usage spread over time (>2x) | Set initial requests to 5th percentile of the actually observed CPU resp. memory usage in production | Set minAllowed to highest observed VPA recommendation (includes start-up phase) for an otherwise practically idle container (avoids pod trashing when pod gets evicted after idling) | Set maxAllowed to fresh node allocatable remainder after daemonset pods (avoids pending pods when requests exceed fresh node allocatable remainder) or, if you really can (otherwise not), to healthy theoretical max load (less disruptive than limits as no throttling or OOM happens on under-utilized nodes) |
| CA | Use for dynamic workloads, definitely if you use HPA and/or VPA | N/A | Set minimum to 0 or number of nodes required right after cluster creation or wake-up | Set maximum to healthy theoretical max load |
Note
Theoretical max load may be very difficult to ascertain, especially with modern software that consists of building blocks you do not own or know in detail. If you have comprehensive monitoring in place, you may be tempted to pick the observed maximum and add a safety margin or even factor on top (2x, 4x, or any other number), but this is not to be confused with “theoretical max load” (solely depending on the code, not observations from the outside). At any point in time, your numbers may change, e.g. because you updated a software component or your usage increased. If you decide to use numbers that are set based only on observations, make sure to flank those numbers with monitoring alerts, so that you have sufficient time to investigate, revise, and readjust if necessary.
Conclusion
Pod autoscaling is a dynamic and complex aspect of Kubernetes, but it is also one of the most powerful tools at your disposal for maintaining efficient, reliable, and cost-effective applications. By carefully selecting the appropriate autoscaler, setting well-considered thresholds, and continuously monitoring and adjusting your strategies, you can ensure that your Kubernetes deployments are well-equipped to handle your resource demands while not over-paying for the provided resources at the same time.
As Kubernetes continues to evolve (e.g. in-place updates) and as new patterns and practices emerge, the approaches to autoscaling may also change. However, the principles discussed above will remain foundational to creating scalable and resilient Kubernetes workloads. Whether you’re a developer or operations engineer, a solid understanding of pod autoscaling will be instrumental in the successful deployment and management of containerized applications.
2 - Specifying a Disruption Budget for Kubernetes Controllers
Introduction of Disruptions
We need to understand that some kind of voluntary disruptions can happen to pods. For example, they can be caused by cluster administrators who want to perform automated cluster actions, like upgrading and autoscaling clusters. Typical application owner actions include:
- deleting the deployment or other controller that manages the pod
- updating a deployment’s pod template causing a restart
- directly deleting a pod (e.g., by accident)
Setup Pod Disruption Budgets
Kubernetes offers a feature called PodDisruptionBudget (PDB) for each application. A PDB limits the number of pods of a replicated application that are down simultaneously from voluntary disruptions.
The most common use case is when you want to protect an application specified by one of the built-in Kubernetes controllers:
- Deployment
- ReplicationController
- ReplicaSet
- StatefulSet
A PodDisruptionBudget has three fields:
- A label selector
.spec.selectorto specify the set of pods to which it applies. .spec.minAvailablewhich is a description of the number of pods from that set that must still be available after the eviction, even in the absence of the evicted pod. minAvailable can be either an absolute number or a percentage..spec.maxUnavailablewhich is a description of the number of pods from that set that can be unavailable after the eviction. It can be either an absolute number or a percentage.
Cluster Upgrade or Node Deletion Failed due to PDB Violation
Misconfiguration of the PDB could block the cluster upgrade or node deletion processes. There are two main cases that can cause a misconfiguration.
Case 1: The replica of Kubernetes controllers is 1
Only 1 replica is running: there is no
replicaCountsetup orreplicaCountfor the Kubernetes controllers is set to 1PDB configuration
  spec:
    minAvailable: 1
To fix this PDB misconfiguration, you need to change the value of
replicaCountfor the Kubernetes controllers to a number greater than 1
Case 2: HPA configuration violates PDB
In Kubernetes, a HorizontalPodAutoscaler automatically updates a workload resource (such as a Deployment or StatefulSet), with the aim of automatically scaling the workload to match demand. The HorizontalPodAutoscaler manages the replicas field of the Kubernetes controllers.
There is no
replicaCountsetup orreplicaCountfor the Kubernetes controllers is set to 1PDB configuration
  spec:
    minAvailable: 1
HPA configuration
  spec:
    minReplicas: 1
To fix this PDB misconfiguration, you need to change the value of HPA
minReplicasto be greater than 1
Related Links
3 - Access a Port of a Pod Locally
Question
You have deployed an application with a web UI or an internal endpoint in your Kubernetes (K8s) cluster. How to access this endpoint without an external load balancer (e.g., Ingress)?
This tutorial presents two options:
- Using Kubernetes port forward
- Using Kubernetes apiserver proxy
Please note that the options described here are mostly for quick testing or troubleshooting your application. For enabling access to your application for productive environment, please refer to the official Kubernetes documentation.
Solution 1: Using Kubernetes Port Forward
You could use the port forwarding functionality of kubectl to access the pods from your local host without involving a service.
To access any pod follow these steps:
- Run
kubectl get pods - Note down the name of the pod in question as
<your-pod-name> - Run
kubectl port-forward <your-pod-name> <local-port>:<your-app-port> - Run a web browser or curl locally and enter the URL:
http(s)://localhost:<local-port>
In addition, kubectl port-forward allows using a resource name, such as a deployment name or service name, to select a matching pod to port forward.
More details can be found in the Kubernetes documentation.
The main drawback of this approach is that the pod’s name changes as soon as it is restarted. Moreover, you need to have a web browser on your client and you need to make sure that the local port is not already used by an application running on your system. Finally, sometimes the port forwarding is canceled due to nonobvious reasons. This leads to a kind of shaky approach. A more stable possibility is based on accessing the app via the kube-proxy, which accesses the corresponding service.

Solution 2: Using the apiserver Proxy of Your Kubernetes Cluster
There are several different proxies in Kubernetes. In this tutorial we will be using apiserver proxy to enable the access to the services in your cluster without Ingress. Unlike the first solution, here a service is required.
Use the following format to compose a URL for accessing your service through an existing proxy on the Kubernetes cluster:
https://<your-cluster-master>/api/v1/namespace/<your-namespace>/services/<your-service>:<your-service-port>/proxy/<service-endpoint>
Example:
| your-main-cluster | your-namespace | your-service | your-service-port | your-service-endpoint | url to access service |
|---|---|---|---|---|---|
| api.testclstr.cpet.k8s.sapcloud.io | default | nginx-svc | 80 | / | http://api.testclstr.cpet.k8s.sapcloud.io/api/v1/namespaces/default/services/nginx-svc:80/proxy/ |
| api.testclstr.cpet.k8s.sapcloud.io | default | docker-nodejs-svc | 4500 | /cpu?baseNumber=4 | https://api.testclstr.cpet.k8s.sapcloud.io/api/v1/namespaces/default/services/docker-nodejs-svc:4500/proxy/cpu?baseNumber=4 |
For more details on the format, please refer to the official Kubernetes documentation.
Note
There are applications which do not support relative URLs yet, e.g. Prometheus (as of November, 2022). This typically leads to missing JavaScript objects, which could be investigated with your browser’s development tools. If such an issue occurs, please use the
port-forwardapproach described above.
4 - Auditing Kubernetes for Secure Setup

Increasing the Security of All Gardener Stakeholders
In summer 2018, the Gardener project team asked Kinvolk to execute several penetration tests in its role as third-party contractor. The goal of this ongoing work was to increase the security of all Gardener stakeholders in the open source community. Following the Gardener architecture, the control plane of a Gardener managed shoot cluster resides in the corresponding seed cluster. This is a Control-Plane-as-a-Service with a network air gap.
Along the way we found various kinds of security issues, for example, due to misconfiguration or missing isolation, as well as two special problems with upstream Kubernetes and its Control-Plane-as-a-Service architecture.
Major Findings
From this experience, we’d like to share a few examples of security issues that could happen on a Kubernetes installation and how to fix them.
Alban Crequy (Kinvolk) and Dirk Marwinski (SAP SE) gave a presentation entitled Hardening Multi-Cloud Kubernetes Clusters as a Service at KubeCon 2018 in Shanghai presenting some of the findings.
Here is a summary of the findings:
Privilege escalation due to insecure configuration of the Kubernetes API server
- Root cause: Same certificate authority (CA) is used for both the API server and the proxy that allows accessing the API server.
- Risk: Users can get access to the API server.
- Recommendation: Always use different CAs.
Exploration of the control plane network with malicious HTTP-redirects
- Root cause: See detailed description below.
- Risk: Provoked error message contains full HTTP payload from an existing endpoint which can be exploited. The contents of the payload depends on your setup, but can potentially be user data, configuration data, and credentials.
- Recommendation:
- Use the latest version of Gardener
- Ensure the seed cluster’s container network supports network policies. Clusters that have been created with Kubify are not protected as Flannel is used there which doesn’t support network policies.
- Recommendation:
Reading private AWS metadata via Grafana
- Root cause: It is possible to configuring a new custom data source in Grafana, we could send HTTP requests to target the control
- Risk: Users can get the “user-data” for the seed cluster from the metadata service and retrieve a kubeconfig for that Kubernetes cluster
- Recommendation: Lockdown Grafana features to only what’s necessary in this setup, block all unnecessary outgoing traffic, move Grafana to a different network, lockdown unauthenticated endpoints
Scenario 1: Privilege Escalation with Insecure API Server
In most configurations, different components connect directly to the Kubernetes API server, often using a kubeconfig with a client
certificate. The API server is started with the flag:
/hyperkube apiserver --client-ca-file=/srv/kubernetes/ca/ca.crt ...
The API server will check whether the client certificate presented by kubectl, kubelet, scheduler or another component is really signed by the configured certificate authority for clients.
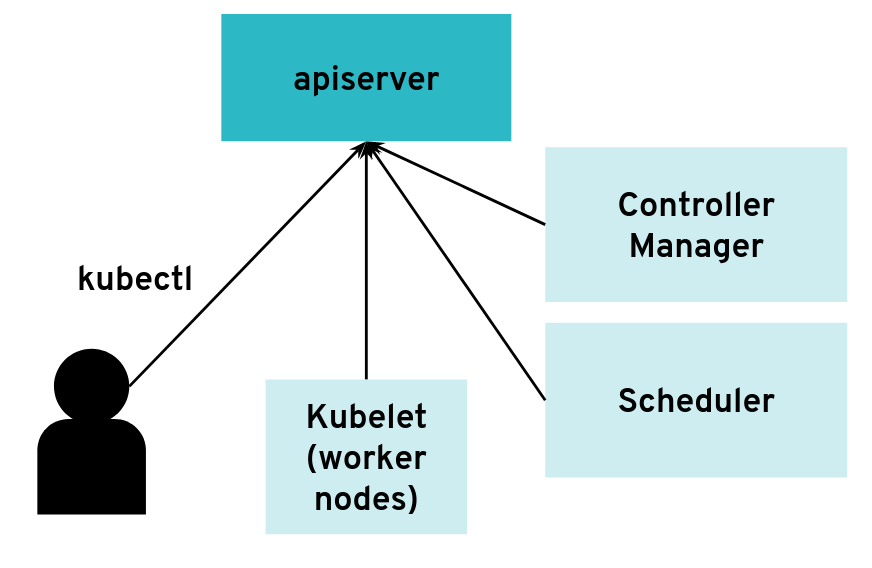 The API server can have many clients of various kinds
However, it is possible to configure the API server differently for use with an intermediate authenticating proxy. The proxy will authenticate the client with its own custom method and then issue HTTP requests to the API server with additional HTTP headers specifying the user name and group name. The API server should only accept HTTP requests with HTTP headers from a legitimate proxy. To allow the API server to check incoming requests, you need pass on a list of certificate authorities (CAs) to it. Requests coming from a proxy are only accepted if they use a client certificate that is signed by one of the CAs of that list.
--requestheader-client-ca-file=/srv/kubernetes/ca/ca-proxy.crt
--requestheader-username-headers=X-Remote-User
--requestheader-group-headers=X-Remote-Group
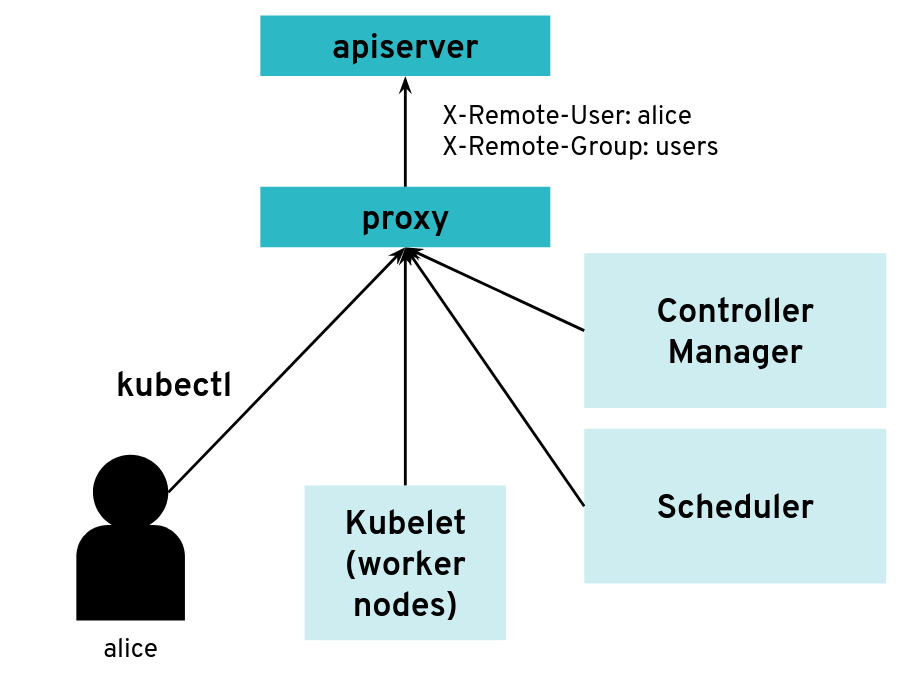 API server clients can reach the API server through an authenticating proxy
So far, so good. But what happens if the malicious user “Mallory” tries to connect directly to the API server and reuses the HTTP headers to pretend to be someone else?
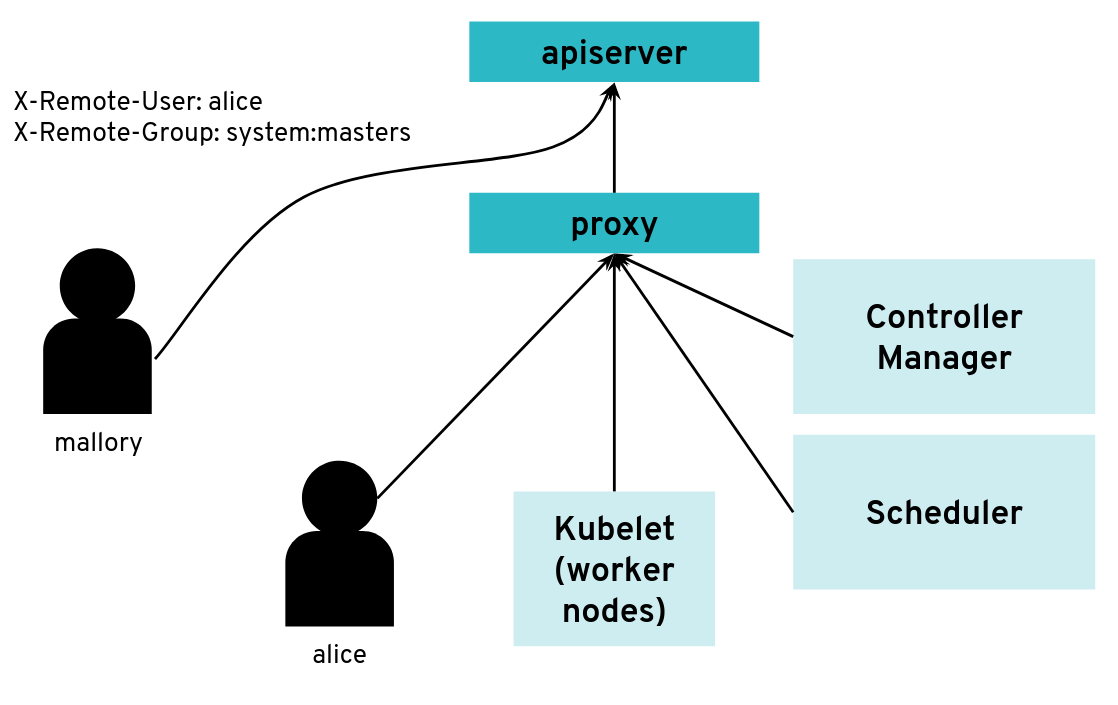 What happens when a client bypasses the proxy, connecting directly to the API server?
With a correct configuration, Mallory’s kubeconfig will have a certificate signed by the API server certificate authority but not signed by the proxy certificate authority. So the API server will not accept the extra HTTP header “X-Remote-Group: system:masters”.
You only run into an issue when the same certificate authority is used for both the API server and the proxy. Then, any Kubernetes client certificate can be used to take the role of different user or group as the API server will accept the user header and group header.
The kubectl tool does not normally add those HTTP headers but it’s pretty easy to generate the corresponding HTTP requests manually.
We worked on improving the Kubernetes documentation to make clearer that this configuration should be avoided.
Scenario 2: Exploration of the Control Plane Network with Malicious HTTP-Redirects
The API server is a central component of Kubernetes and many components initiate connections to it, including the kubelet running on worker nodes. Most of the requests from those clients will end up updating Kubernetes objects (pods, services, deployments, and so on) in the etcd database but the API server usually does not need to initiate TCP connections itself.
 The API server is mostly a component that receives requests
However, there are exceptions. Some kubectl commands will trigger the API server to open a new connection to the kubelet. kubectl exec is one of those commands. In order to get the standard I/Os from the pod, the API server will start an HTTP connection to the kubelet on the worker node where the pod is running. Depending on the container runtime used, it can be done in different ways, but one way to do it is for the kubelet to reply with a HTTP-302 redirection to the Container Runtime Interface (CRI). Basically, the kubelet is telling the API server to get the streams from CRI itself directly instead of forwarding. The redirection from the kubelet will only change the port and path from the URL; the IP address will not be changed because the kubelet and the CRI component run on the same worker node.
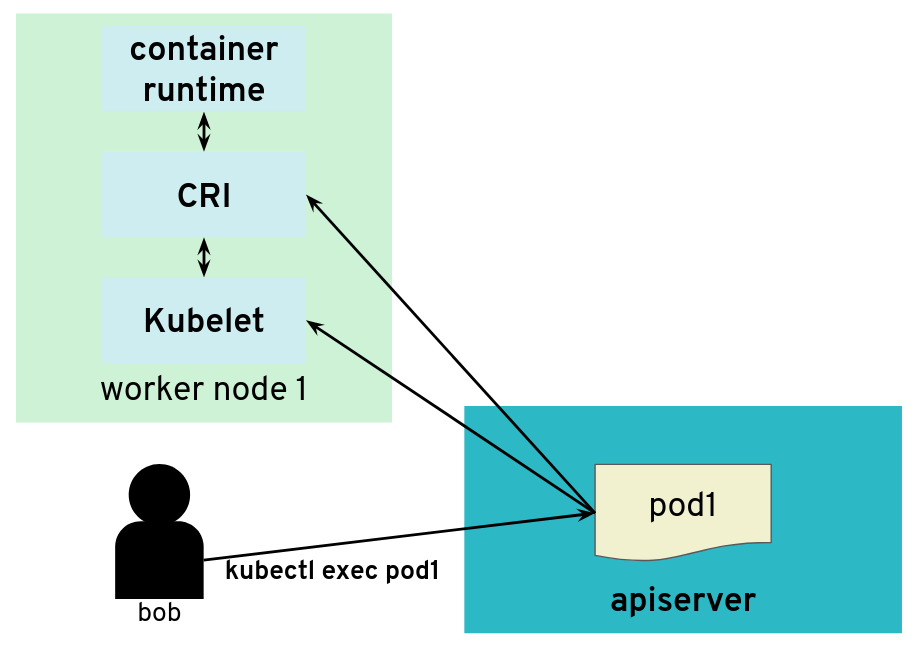 But the API server also initiates some connections, for example, to worker nodes
It’s often quite easy for users of a Kubernetes cluster to get access to worker nodes and tamper with the kubelet. They could be given explicit SSH access or they could be given a kubeconfig with enough privileges to create privileged pods or even just pods with “host” volumes.
In contrast, users (even those with “system:masters” permissions or “root” rights) are often not given access to the control plane. On setups like, for example, GKE or Gardener, the control plane is running on separate nodes, with a different administrative access. It could be hosted on a different cloud provider account. So users are not free to explore the internal networking the control plane.
What would happen if a user was tampering with the kubelet to make it maliciously redirect kubectl exec requests to a different random endpoint? Most likely the given endpoint would not speak to the streaming server protocol, so there would be an error. However, the full HTTP payload from the endpoint is included in the error message printed by kubectl exec.
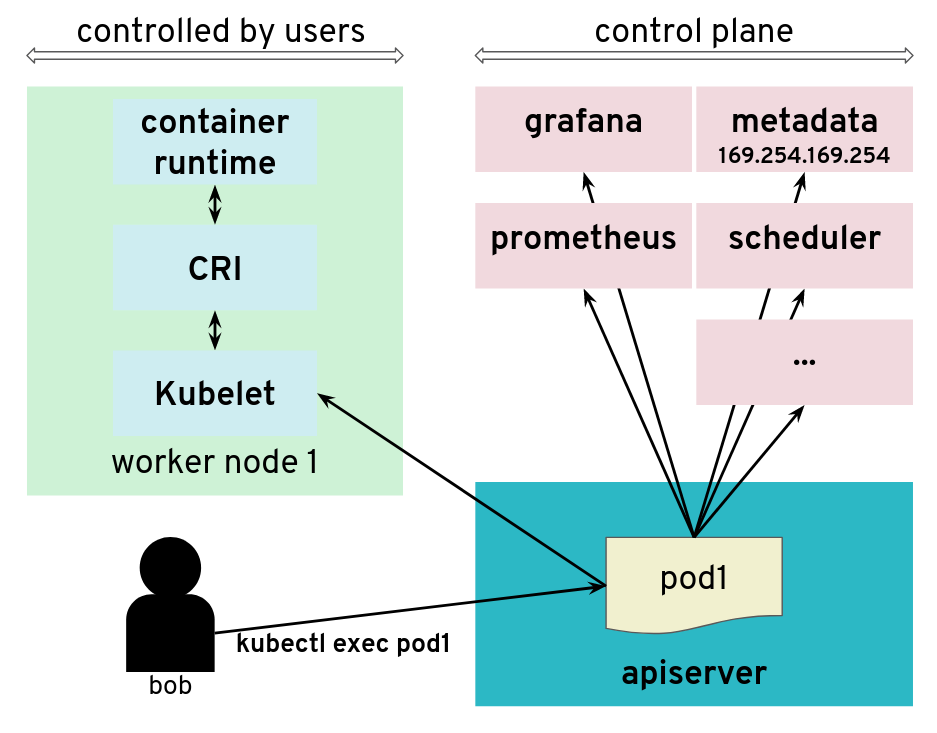 The API server is tricked to connect to other components
The impact of this issue depends on the specific setup. But in many configurations, we could find a metadata service (such as the AWS metadata service) containing user data, configurations and credentials. The setup we explored had a different AWS account and a different EC2 instance profile for the worker nodes and the control plane. This issue allowed users to get access to the AWS metadata service in the context of the control plane, which they should not have access to.
We have reported this issue to the Kubernetes Security mailing list and the public pull request that addresses the issue has been merged PR#66516. It provides a way to enforce HTTP redirect validation (disabled by default).
But there are several other ways that users could trigger the API server to generate HTTP requests and get the reply payload back, so it is advised to isolate the API server and other components from the network as additional precautious measures. Depending on where the API server runs, it could be with Kubernetes Network Policies, EC2 Security Groups or just iptables directly. Following the defense in depth principle, it is a good idea to apply the API server HTTP redirect validation when it is available as well as firewall rules.
In Gardener, this has been fixed with Kubernetes network policies along with changes to ensure the API server does not need to contact the metadata service. You can see more details in the announcements on the Gardener mailing list. This is tracked in CVE-2018-2475.
To be protected from this issue, stakeholders should:
- Use the latest version of Gardener
- Ensure the seed cluster’s container network supports network policies. Clusters that have been created with Kubify are not protected as Flannel is used there which doesn’t support network policies.
Scenario 3: Reading Private AWS Metadata via Grafana
For our tests, we had access to a Kubernetes setup where users are not only given access to the API server in the control plane, but also to a Grafana instance that is used to gather data from their Kubernetes clusters via Prometheus. The control plane is managed and users don’t have access to the nodes that it runs. They can only access the API server and Grafana via a load balancer. The internal network of the control plane is therefore hidden to users.
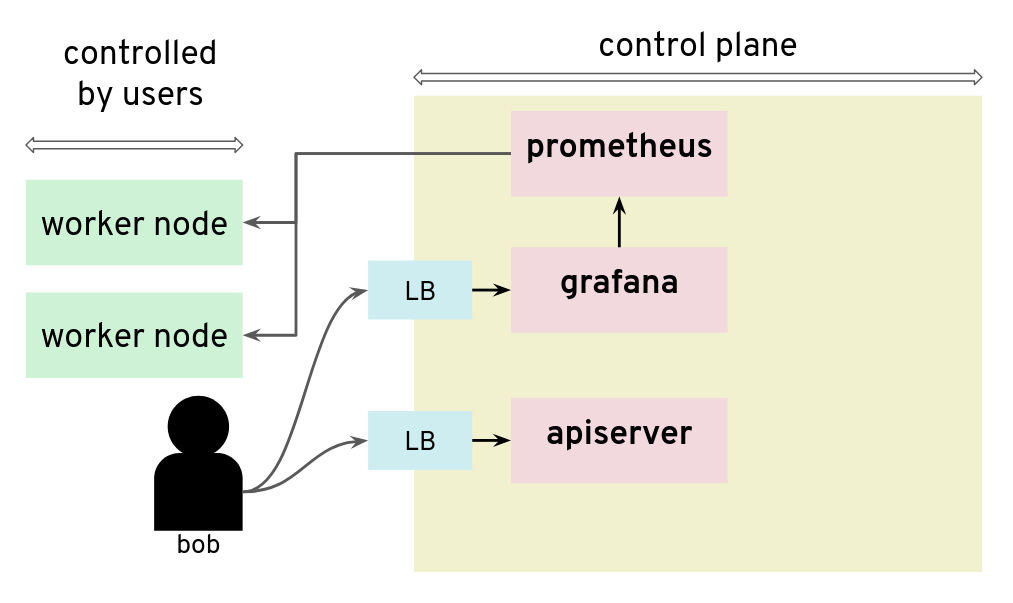 Prometheus and Grafana can be used to monitor worker nodes
Unfortunately, that setup was not protecting the control plane network from nosy users. By configuring a new custom data source in Grafana, we could send HTTP requests to target the control plane network, for example the AWS metadata service. The reply payload is not displayed on the Grafana Web UI but it is possible to access it from the debugging console of the Chrome browser.
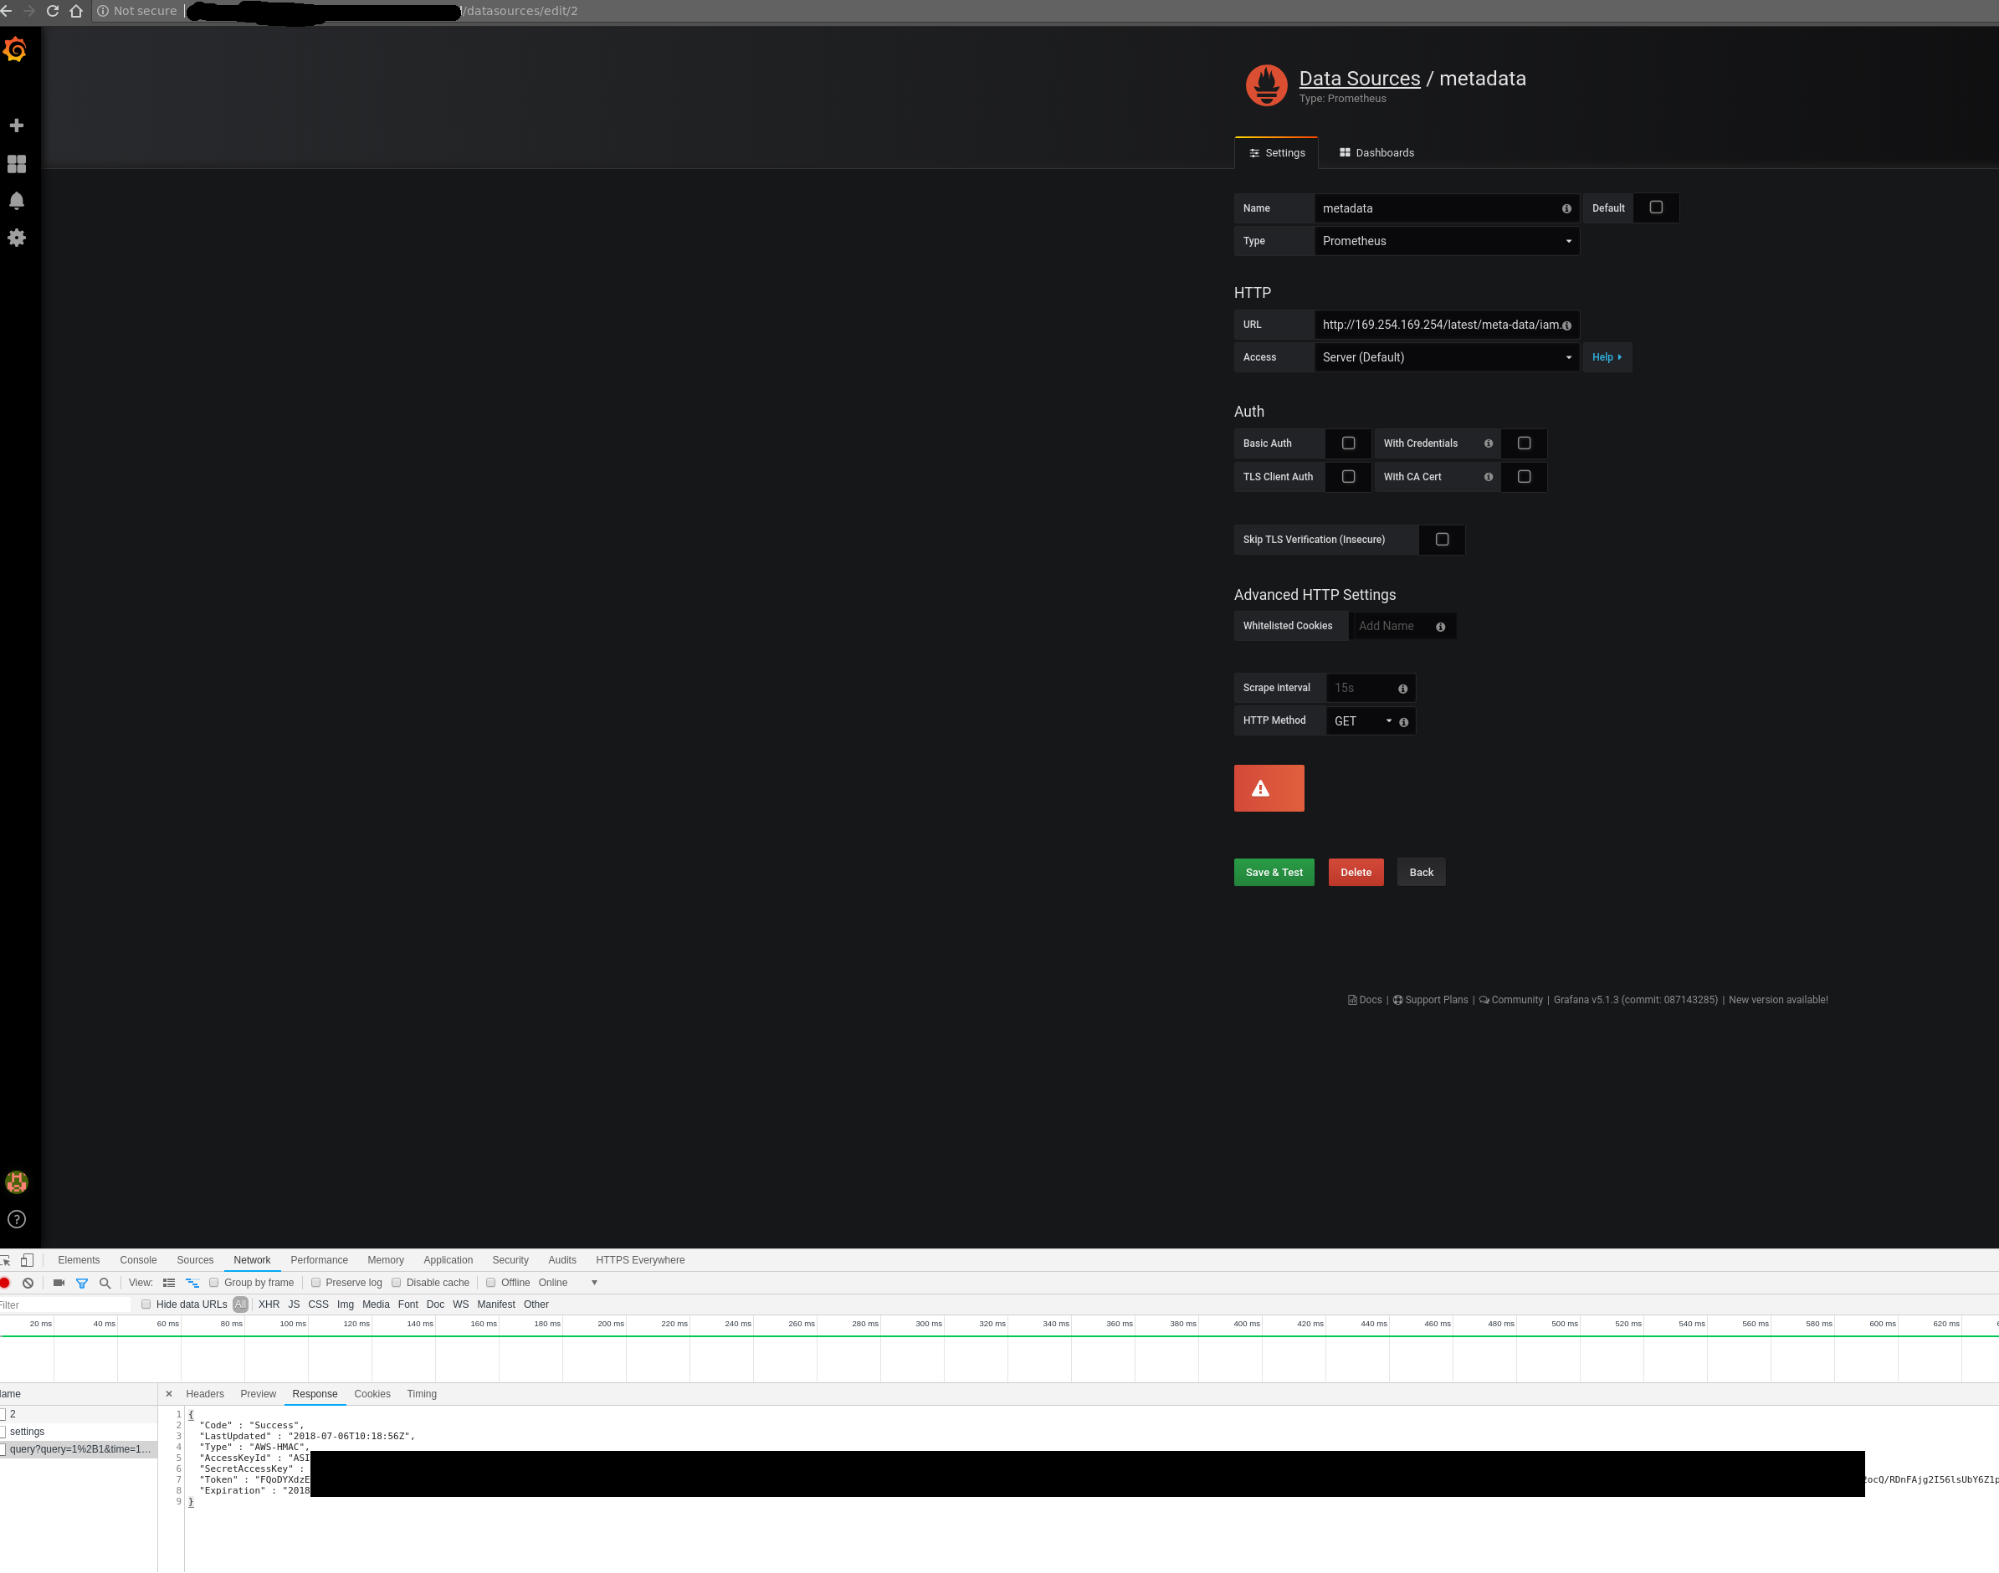 Credentials can be retrieved from the debugging console of Chrome
 Adding a Grafana data source is a way to issue HTTP requests to arbitrary targets
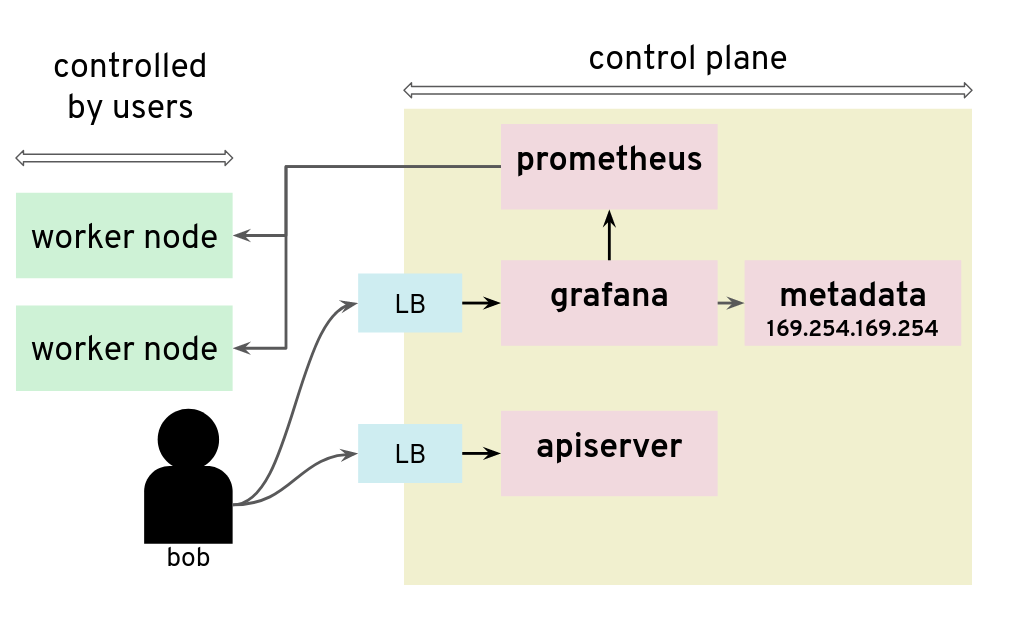
In that installation, users could get the “user-data” for the seed cluster from the metadata service and retrieve a kubeconfig for that Kubernetes cluster.
There are many possible measures to avoid this situation: lockdown Grafana features to only what’s necessary in this setup, block all unnecessary outgoing traffic, move Grafana to a different network, or lockdown unauthenticated endpoints, among others.
Conclusion
The three scenarios above show pitfalls with a Kubernetes setup. A lot of them were specific to the Kubernetes installation: different cloud providers or different configurations will show different weaknesses. Users should no longer be given access to Grafana.
5 - Container Image Not Pulled
Problem
Two of the most common causes of this problems are specifying the wrong container image or trying to use private images without providing registry credentials.
Note
There is no observable difference in pod status between a missing image and incorrect registry permissions. In either case, Kubernetes will report an
ErrImagePullstatus for the pods. For this reason, this article deals with both scenarios.
Example
Let’s see an example. We’ll create a pod named fail, referencing a non-existent Docker image:
kubectl run -i --tty fail --image=tutum/curl:1.123456
The command doesn’t return and you can terminate the process with Ctrl+C.
Error Analysis
We can then inspect our pods and see that we have one pod with a status of ErrImagePull or ImagePullBackOff.
$ (minikube) kubectl get pods
NAME                      READY     STATUS         RESTARTS   AGE
client-5b65b6c866-cs4ch   1/1       Running        1          1m
fail-6667d7685d-7v6w8     0/1       ErrImagePull   0          <invalid>
vuejs-578574b75f-5x98z    1/1       Running        0          1d
$ (minikube)
For some additional information, we can describe the failing pod.
kubectl describe pod fail-6667d7685d-7v6w8
As you can see in the events section, your image can’t be pulled:
Name:   fail-6667d7685d-7v6w8
Namespace: default
Node:   minikube/192.168.64.10
Start Time: Wed, 22 Nov 2017 10:01:59 +0100
Labels:   pod-template-hash=2223832418
    run=fail
Annotations: kubernetes.io/created-by={"kind":"SerializedReference","apiVersion":"v1","reference":{"kind":"ReplicaSet","namespace":"default","name":"fail-6667d7685d","uid":"cc4ccb3f-cf63-11e7-afca-4a7a1fa05b3f","a...
.
.
.
.
Events:
  FirstSeen	LastSeen	Count	From			SubObjectPath		Type		Reason			Message
  ---------	--------	-----	----			-------------		--------	------			-------
  1m		1m		1	default-scheduler				Normal		Scheduled		Successfully assigned fail-6667d7685d-7v6w8 to minikube
  1m		1m		1	kubelet, minikube				Normal		SuccessfulMountVolume	MountVolume.SetUp succeeded for volume "default-token-9fr6r"
  1m		6s		4	kubelet, minikube	spec.containers{fail}	Normal		Pulling			pulling image "tutum/curl:1.123456"
  1m		5s		4	kubelet, minikube	spec.containers{fail}	Warning		Failed			Failed to pull image "tutum/curl:1.123456": rpc error: code = Unknown desc = Error response from daemon: manifest for tutum/curl:1.123456 not found
  1m		<invalid>	10	kubelet, minikube				Warning		FailedSync		Error syncing pod
  1m		<invalid>	6	kubelet, minikube	spec.containers{fail}	Normal		BackOff			Back-off pulling image "tutum/curl:1.123456"
Why couldn’t Kubernetes pull the image? There are three primary candidates besides network connectivity issues:
- The image tag is incorrect
- The image doesn’t exist
- Kubernetes doesn’t have permissions to pull that image
If you don’t notice a typo in your image tag, then it’s time to test using your local machine. I usually start by
running docker pull on my local development machine with the exact same image tag. In this case, I would
run docker pull tutum/curl:1.123456.
If this succeeds, then it probably means that Kubernetes doesn’t have the correct permissions to pull that image.
Add the docker registry user/pwd to your cluster:
kubectl create secret docker-registry dockersecret --docker-server=https://index.docker.io/v1/ --docker-username=<username> --docker-password=<password> --docker-email=<email>
If the exact image tag fails, then I will test without an explicit image tag:
docker pull tutum/curl
This command will attempt to pull the latest tag. If this succeeds, then that means the originally specified tag doesn’t exist. Go to the Docker registry and check which tags are available for this image.
If docker pull tutum/curl (without an exact tag) fails, then we have a bigger problem - that image does not exist at all in our image registry.
6 - Container Image Not Updating
Introduction
A container image should use a fixed tag or the SHA of the image. It should not use the tags latest, head, canary, or other tags that are designed to be floating.
Problem
If you have encountered this issue, you have probably done something along the lines of:
- Deploy anything using an image tag (e.g.,
cp-enablement/awesomeapp:1.0) - Fix a bug in awesomeapp
- Build a new image and push it with the same tag (
cp-enablement/awesomeapp:1.0) - Update the deployment
- Realize that the bug is still present
- Repeat steps 3-5 without any improvement
The problem relates to how Kubernetes decides whether to do a docker pull when starting a container.
Since we tagged our image as :1.0, the default pull policy is IfNotPresent. The Kubelet already has a local
copy of cp-enablement/awesomeapp:1.0, so it doesn’t attempt to do a docker pull. When the new Pods come up,
they’re still using the old broken Docker image.
There are a couple of ways to resolve this, with the recommended one being to use unique tags.
Solution
In order to fix the problem, you can use the following bash script that runs anytime the deployment is updated to create a new tag and push it to the registry.
#!/usr/bin/env bash

# Set the docker image name and the corresponding repository
# Ensure that you change them in the deployment.yml as well.
# You must be logged in with docker login.
#
# CHANGE THIS TO YOUR Docker.io SETTINGS
#
PROJECT=awesomeapp
REPOSITORY=cp-enablement

# causes the shell to exit if any subcommand or pipeline returns a non-zero status.
#
set -e

# set debug mode
#
set -x

# build my nodeJS app
#
npm run build

# get the latest version ID from the Docker.io registry and increment them
#
VERSION=$(curl https://registry.hub.docker.com/v1/repositories/$REPOSITORY/$PROJECT/tags  | sed -e 's/[][]//g' -e 's/"//g' -e 's/ //g' | tr '}' '\n'  | awk -F: '{print $3}' | grep v| tail -n 1)
VERSION=${VERSION:1}
((VERSION++))
VERSION="v$VERSION"


# build the new docker image
#
echo '>>> Building new image'

echo '>>> Push new image'
docker push $REPOSITORY/$PROJECT:$VERSION
7 - Custom Seccomp Profile
Overview
Seccomp (secure computing mode) is a security facility in the Linux kernel for restricting the set of system calls applications can make.
Starting from Kubernetes v1.3.0, the Seccomp feature is in Alpha. To configure it on a Pod, the following annotations can be used:
seccomp.security.alpha.kubernetes.io/pod: <seccomp-profile>where<seccomp-profile>is the seccomp profile to apply to all containers in aPod.container.seccomp.security.alpha.kubernetes.io/<container-name>: <seccomp-profile>where<seccomp-profile>is the seccomp profile to apply to<container-name>in aPod.
More details can be found in the PodSecurityPolicy documentation.
Installation of a Custom Profile
By default, kubelet loads custom Seccomp profiles from /var/lib/kubelet/seccomp/. There are two ways in which Seccomp profiles can be added to a Node:
- to be baked in the machine image
- to be added at runtime
This guide focuses on creating those profiles via a DaemonSet.
Create a file called seccomp-profile.yaml with the following content:
apiVersion: v1
kind: ConfigMap
metadata:
  name: seccomp-profile
  namespace: kube-system
data:
  my-profile.json: |
    {
      "defaultAction": "SCMP_ACT_ALLOW",
      "syscalls": [
        {
          "name": "chmod",
          "action": "SCMP_ACT_ERRNO"
        }
      ]
    }
Note
The policy above is a very simple one and not suitable for complex applications. The default docker profile can be used a reference. Feel free to modify it to your needs.
Apply the ConfigMap in your cluster:
$ kubectl apply -f seccomp-profile.yaml
configmap/seccomp-profile created
The next steps is to create the DaemonSet Seccomp installer. It’s going to copy the policy from above in /var/lib/kubelet/seccomp/my-profile.json.
Create a file called seccomp-installer.yaml with the following content:
apiVersion: apps/v1
kind: DaemonSet
metadata:
  name: seccomp
  namespace: kube-system
  labels:
    security: seccomp
spec:
  selector:
    matchLabels:
      security: seccomp
  template:
    metadata:
      labels:
        security: seccomp
    spec:
      initContainers:
      - name: installer
        image: alpine:3.10.0
        command: ["/bin/sh", "-c", "cp -r -L /seccomp/*.json /host/seccomp/"]
        volumeMounts:
        - name: profiles
          mountPath: /seccomp
        - name: hostseccomp
          mountPath: /host/seccomp
          readOnly: false
      containers:
      - name: pause
        image: k8s.gcr.io/pause:3.1
      terminationGracePeriodSeconds: 5
      volumes:
      - name: hostseccomp
        hostPath:
          path: /var/lib/kubelet/seccomp
      - name: profiles
        configMap:
          name: seccomp-profile
Create the installer and wait until it’s ready on all Nodes:
$ kubectl apply -f seccomp-installer.yaml
daemonset.apps/seccomp-installer created

$ kubectl -n kube-system get pods -l security=seccomp
NAME                      READY   STATUS    RESTARTS   AGE
seccomp-installer-wjbxq   1/1     Running   0          21s
Create a Pod Using a Custom Seccomp Profile
Finally, we want to create a profile which uses our new Seccomp profile my-profile.json.
Create a file called my-seccomp-pod.yaml with the following content:
apiVersion: v1
kind: Pod
metadata:
  name: seccomp-app
  namespace: default
  annotations:
    seccomp.security.alpha.kubernetes.io/pod: "localhost/my-profile.json"
    # you can specify seccomp profile per container. If you add another profile you can configure
    # it for a specific container - 'pause' in this case.
    # container.seccomp.security.alpha.kubernetes.io/pause: "localhost/some-other-profile.json"
spec:
  containers:
  - name: pause
    image: k8s.gcr.io/pause:3.1
Create the Pod and see that it’s running:
$ kubectl apply -f my-seccomp-pod.yaml
pod/seccomp-app created

$ kubectl get pod seccomp-app
NAME         READY   STATUS    RESTARTS   AGE
seccomp-app  1/1     Running   0          42s
Throubleshooting
If an invalid or a non-existing profile is used, then the Pod will be stuck in ContainerCreating phase:
broken-seccomp-pod.yaml:
apiVersion: v1
kind: Pod
metadata:
  name: broken-seccomp
  namespace: default
  annotations:
    seccomp.security.alpha.kubernetes.io/pod: "localhost/not-existing-profile.json"
spec:
  containers:
  - name: pause
    image: k8s.gcr.io/pause:3.1
$ kubectl apply -f broken-seccomp-pod.yaml
pod/broken-seccomp created

$ kubectl get pod broken-seccomp
NAME            READY   STATUS              RESTARTS   AGE
broken-seccomp  1/1     ContainerCreating   0          2m

$ kubectl describe pod broken-seccomp
Name:               broken-seccomp
Namespace:          default
....
Events:
  Type     Reason                  Age               From                     Message
  ----     ------                  ----              ----                     -------
  Normal   Scheduled               18s               default-scheduler        Successfully assigned kube-system/broken-seccomp to docker-desktop
  Warning  FailedCreatePodSandBox  4s (x2 over 18s)  kubelet, docker-desktop  Failed create pod sandbox: rpc error: code = Unknown desc = failed to make sandbox docker config for pod "broken-seccomp": failed to generate sandbox security options
for sandbox "broken-seccomp": failed to generate seccomp security options for container: cannot load seccomp profile "/var/lib/kubelet/seccomp/not-existing-profile.json": open /var/lib/kubelet/seccomp/not-existing-profile.json: no such file or directory
Related Links
8 - Dockerfile Pitfalls
Using the latest Tag for an Image
Many Dockerfiles use the FROM package:latest pattern at the top of their Dockerfiles to pull the latest image from a Docker registry.
Bad Dockerfile
FROM alpine
While simple, using the latest tag for an image means that your build can suddenly break if that image gets updated. This can lead to problems where everything builds fine locally (because your local cache thinks it is the latest), while a build server may fail, because some pipelines make a clean pull on every build. Additionally, troubleshooting can prove to be difficult, since the maintainer of the Dockerfile didn’t actually make any changes.
Good Dockerfile
A digest takes the place of the tag when pulling an image. This will ensure that your Dockerfile remains immutable.
FROM alpine@sha256:7043076348bf5040220df6ad703798fd8593a0918d06d3ce30c6c93be117e430
Running apt/apk/yum update
Running apt-get install is one of those things virtually every Debian-based Dockerfile will have to do in order to satiate some external package requirements your code needs to run. However, using apt-get as an example, this comes with its own problems.
apt-get upgrade
This will update all your packages to their latests versions, which can be bad because it prevents your Dockerfile from creating consistent, immutable builds.
apt-get update (in a different line than the one running your apt-get install command)
Running apt-get update as a single line entry will get cached by the build and won’t actually run every time you need to run apt-get install. Instead, make sure you run apt-get update in the same line with all the packages to ensure that all are updated correctly.
Avoid Big Container Images
Building a small container image will reduce the time needed to start or restart pods. An image based on the popular Alpine Linux project is much smaller than most distribution based images (~5MB). For most popular languages and products, there is usually an official Alpine Linux image, e.g., golang, nodejs, and postgres.
$  docker images
REPOSITORY                                                      TAG                     IMAGE ID            CREATED             SIZE
postgres                                                        9.6.9-alpine            6583932564f8        13 days ago         39.26 MB
postgres                                                        9.6                     d92dad241eff        13 days ago         235.4 MB
postgres                                                        10.4-alpine             93797b0f31f4        13 days ago         39.56 MB
In addition, for compiled languages such as Go or C++ that do not require build time tooling during runtime, it is recommended to avoid build time tooling in the final images. With Docker’s support for multi-stages builds, this can be easily achieved with minimal effort. Such an example can be found at Multi-stage builds.
Google’s distroless image is also a good base image.
9 - Dynamic Volume Provisioning
Overview
The example shows how to run a Postgres database on Kubernetes and how to dynamically provision and mount the storage volumes needed by the database
Run Postgres Database
Define the following Kubernetes resources in a yaml file:
- PersistentVolumeClaim (PVC)
- Deployment
PersistentVolumeClaim
apiVersion: v1
kind: PersistentVolumeClaim
metadata:
  name: postgresdb-pvc
spec:
  accessModes:
    - ReadWriteOnce
  resources:
    requests:
      storage: 9Gi
  storageClassName: 'default'
This defines a PVC using the storage class default. Storage classes abstract from the underlying storage provider as well as other parameters, like disk-type (e.g., solid-state vs standard disks).
The default storage class has the annotation {“storageclass.kubernetes.io/is-default-class”:“true”}.
$ kubectl describe sc default
Name:            default
IsDefaultClass:  Yes
Annotations:     kubectl.kubernetes.io/last-applied-configuration={"apiVersion":"storage.k8s.io/v1beta1","kind":"StorageClass","metadata":{"annotations":{"storageclass.kubernetes.io/is-default-class":"true"},"labels":{"addonmanager.kubernetes.io/mode":"Exists"},"name":"default","namespace":""},"parameters":{"type":"gp2"},"provisioner":"kubernetes.io/aws-ebs"}
,storageclass.kubernetes.io/is-default-class=true
Provisioner:           kubernetes.io/aws-ebs
Parameters:            type=gp2
AllowVolumeExpansion:  <unset>
MountOptions:          <none>
ReclaimPolicy:         Delete
VolumeBindingMode:     Immediate
Events:                <none>
A Persistent Volume is automatically created when it is dynamically provisioned. In the following example, the PVC is defined as “postgresdb-pvc”, and a corresponding PV “pvc-06c81c30-72ea-11e8-ada2-aa3b2329c8bb” is created and associated with the PVC automatically.
$ kubectl create -f .\postgres_deployment.yaml
persistentvolumeclaim "postgresdb-pvc" created

$ kubectl get pv
NAME                                       CAPACITY   ACCESS MODES   RECLAIM POLICY   STATUS    CLAIM                    STORAGECLASS   REASON    AGE
pvc-06c81c30-72ea-11e8-ada2-aa3b2329c8bb   9Gi        RWO            Delete           Bound     default/postgresdb-pvc   default                  3s

$ kubectl get pvc
NAME             STATUS    VOLUME                                     CAPACITY   ACCESS MODES   STORAGECLASS   AGE
postgresdb-pvc   Bound     pvc-06c81c30-72ea-11e8-ada2-aa3b2329c8bb   9Gi        RWO            default        8s
Notice that the RECLAIM POLICY is Delete (default value), which is one of the two reclaim policies, the other one is Retain. (A third policy Recycle has been deprecated). In the case of Delete, the PV is deleted automatically when the PVC is removed, and the data on the PVC will also be lost.
On the other hand, a PV with Retain policy will not be deleted when the PVC is removed, and moved to Release status, so that data can be recovered by Administrators later.
You can use the kubectl patch command to change the reclaim policy as described in Change the Reclaim Policy of a PersistentVolume
or use kubectl edit pv <pv-name> to edit it online as shown below:
$ kubectl get pv
NAME                                       CAPACITY   ACCESS MODES   RECLAIM POLICY   STATUS    CLAIM                    STORAGECLASS   REASON    AGE
pvc-06c81c30-72ea-11e8-ada2-aa3b2329c8bb   9Gi        RWO            Delete           Bound     default/postgresdb-pvc   default                  44m

# change the reclaim policy from "Delete" to "Retain"
$ kubectl edit pv pvc-06c81c30-72ea-11e8-ada2-aa3b2329c8bb
persistentvolume "pvc-06c81c30-72ea-11e8-ada2-aa3b2329c8bb" edited

# check the reclaim policy afterwards
$ kubectl get pv
NAME                                       CAPACITY   ACCESS MODES   RECLAIM POLICY   STATUS    CLAIM                    STORAGECLASS   REASON    AGE
pvc-06c81c30-72ea-11e8-ada2-aa3b2329c8bb   9Gi        RWO            Retain           Bound     default/postgresdb-pvc   default                  45m
Deployment
Once a PVC is created, you can use it in your container via volumes.persistentVolumeClaim.claimName. In the below example, the PVC postgresdb-pvc is mounted as readable and writable, and in volumeMounts two paths in the container are mounted to subfolders in the volume.
apiVersion: apps/v1
kind: Deployment
metadata:
  name: postgres
  namespace: default
  labels:
    app: postgres
  annotations:
    deployment.kubernetes.io/revision: "1"
spec:
  replicas: 1
  strategy:
    type: RollingUpdate
    rollingUpdate:
      maxUnavailable: 1
      maxSurge: 1
  selector:
    matchLabels:
      app: postgres
  template:
    metadata:
      name: postgres
      labels:
        app: postgres
    spec:
      containers:
        - name: postgres
          image: "cpettech.docker.repositories.sap.ondemand.com/jtrack_postgres:howto"
          env:
            - name: POSTGRES_USER
              value: postgres
            - name: POSTGRES_PASSWORD
              value: p5FVqfuJFrM42cVX9muQXxrC3r8S9yn0zqWnFR6xCoPqxqVQ
            - name: POSTGRES_INITDB_XLOGDIR
              value: "/var/log/postgresql/logs"
          ports:
            - containerPort: 5432
          volumeMounts:
            - mountPath: /var/lib/postgresql/data
              name: postgre-db
              subPath: data     # https://github.com/kubernetes/website/pull/2292.  Solve the issue of crashing initdb due to non-empty directory (i.e. lost+found)
            - mountPath: /var/log/postgresql/logs
              name: postgre-db
              subPath: logs
      volumes:
        - name: postgre-db
          persistentVolumeClaim:
            claimName: postgresdb-pvc
            readOnly: false
      imagePullSecrets:
      - name: cpettechregistry
To check the mount points in the container:
$ kubectl get po
NAME                        READY     STATUS    RESTARTS   AGE
postgres-7f485fd768-c5jf9   1/1       Running   0          32m

$ kubectl exec -it postgres-7f485fd768-c5jf9 bash

root@postgres-7f485fd768-c5jf9:/# ls /var/lib/postgresql/data/
base    pg_clog       pg_dynshmem  pg_ident.conf  pg_multixact  pg_replslot  pg_snapshots  pg_stat_tmp  pg_tblspc    PG_VERSION  postgresql.auto.conf  postmaster.opts
global  pg_commit_ts  pg_hba.conf  pg_logical     pg_notify     pg_serial    pg_stat       pg_subtrans  pg_twophase  pg_xlog     postgresql.conf       postmaster.pid

root@postgres-7f485fd768-c5jf9:/# ls /var/log/postgresql/logs/
000000010000000000000001  archive_status
Deleting a PersistentVolumeClaim
In case of a Delete policy, deleting a PVC will also delete its associated PV. If Retain is the reclaim policy, the PV will change status from Bound to Released when the PVC is deleted.
# Check pvc and pv before deletion
$ kubectl get pvc
NAME             STATUS    VOLUME                                     CAPACITY   ACCESS MODES   STORAGECLASS   AGE
postgresdb-pvc   Bound     pvc-06c81c30-72ea-11e8-ada2-aa3b2329c8bb   9Gi        RWO            default        50m

$ kubectl get pv
NAME                                       CAPACITY   ACCESS MODES   RECLAIM POLICY   STATUS    CLAIM                    STORAGECLASS   REASON    AGE
pvc-06c81c30-72ea-11e8-ada2-aa3b2329c8bb   9Gi        RWO            Retain           Bound     default/postgresdb-pvc   default                  50m

# delete pvc
$ kubectl delete pvc postgresdb-pvc
persistentvolumeclaim "postgresdb-pvc" deleted

# pv changed to status "Released"
$ kubectl get pv
NAME                                       CAPACITY   ACCESS MODES   RECLAIM POLICY   STATUS     CLAIM                    STORAGECLASS   REASON    AGE
pvc-06c81c30-72ea-11e8-ada2-aa3b2329c8bb   9Gi        RWO            Retain           Released   default/postgresdb-pvc   default                  51m
10 - Install Knative in Gardener Clusters
Overview
This guide walks you through the installation of the latest version of Knative using pre-built images on a Gardener created cluster environment. To set up your own Gardener, see the documentation or have a look at the landscape-setup-template project. To learn more about this open source project, read the blog on kubernetes.io.
Prerequisites
Knative requires a Kubernetes cluster v1.15 or newer.
Steps
Install and Configure kubectl
If you already have
kubectlCLI, runkubectl version --shortto check the version. You need v1.10 or newer. If yourkubectlis older, follow the next step to install a newer version.
Access Gardener
Create a project in the Gardener dashboard. This will essentially create a Kubernetes namespace with the name
garden-<my-project>.Configure access to your Gardener project using a kubeconfig.
If you are not the Gardener Administrator already, you can create a technical user in the Gardener dashboard. Go to the “Members” section and add a service account. You can then download the kubeconfig for your project. You can skip this step if you create your cluster using the user interface; it is only needed for programmatic access, make sure you set
export KUBECONFIG=garden-my-project.yamlin your shell.
Creating a Kubernetes Cluster
You can create your cluster using kubectl CLI by providing a cluster specification yaml file. You can find an example for GCP in the gardener/gardener repository. Make sure the namespace matches that of your project. Then just apply the prepared so-called “shoot” cluster CRD with kubectl:
kubectl apply --filename my-cluster.yaml
The easier alternative is to create the cluster following the cluster creation wizard in the Gardener dashboard:

Configure kubectl for Your Cluster
You can now download the kubeconfig for your freshly created cluster in the Gardener dashboard or via the CLI as follows:
kubectl --namespace shoot--my-project--my-cluster get secret kubecfg --output jsonpath={.data.kubeconfig} | base64 --decode > my-cluster.yaml
This kubeconfig file has full administrators access to you cluster. For the rest of this guide, be sure you have export KUBECONFIG=my-cluster.yaml set.
Installing Istio
Knative depends on Istio. If your cloud platform offers a managed Istio installation, we recommend installing Istio that way, unless you need the ability to customize your installation.
Otherwise, see the Installing Istio for Knative guide to install Istio.
You must install Istio on your Kubernetes cluster before continuing with these instructions to install Knative.
Installing cluster-local-gateway for Serving Cluster-Internal Traffic
If you installed Istio, you can install a cluster-local-gateway within your Knative cluster so that you can serve cluster-internal traffic. If you want to configure your revisions to use routes that are visible only within your cluster, install and use the cluster-local-gateway.
Installing Knative
The following commands install all available Knative components as well as the standard set of observability plugins. Knative’s installation guide - Installing Knative.
If you are upgrading from Knative 0.3.x: Update your domain and static IP address to be associated with the LoadBalancer
istio-ingressgatewayinstead ofknative-ingressgateway. Then run the following to clean up leftover resources:kubectl delete svc knative-ingressgateway -n istio-system kubectl delete deploy knative-ingressgateway -n istio-systemIf you have the Knative Eventing Sources component installed, you will also need to delete the following resource before upgrading:
kubectl delete statefulset/controller-manager -n knative-sourcesWhile the deletion of this resource during the upgrade process will not prevent modifications to Eventing Source resources, those changes will not be completed until the upgrade process finishes.
To install Knative, first install the CRDs by running the
kubectl applycommand once with the-l knative.dev/crd-install=trueflag. This prevents race conditions during the install, which cause intermittent errors:kubectl apply --selector knative.dev/crd-install=true \ --filename https://github.com/knative/serving/releases/download/v0.12.1/serving.yaml \ --filename https://github.com/knative/eventing/releases/download/v0.12.1/eventing.yaml \ --filename https://github.com/knative/serving/releases/download/v0.12.1/monitoring.yamlTo complete the installation of Knative and its dependencies, run the
kubectl applycommand again, this time without the--selectorflag:kubectl apply --filename https://github.com/knative/serving/releases/download/v0.12.1/serving.yaml \ --filename https://github.com/knative/eventing/releases/download/v0.12.1/eventing.yaml \ --filename https://github.com/knative/serving/releases/download/v0.12.1/monitoring.yamlMonitor the Knative components until all of the components show a
STATUSofRunning:kubectl get pods --namespace knative-serving kubectl get pods --namespace knative-eventing kubectl get pods --namespace knative-monitoring
Set Your Custom Domain
- Fetch the external IP or CNAME of the knative-ingressgateway:
kubectl --namespace istio-system get service knative-ingressgateway
NAME                     TYPE           CLUSTER-IP      EXTERNAL-IP     PORT(S)                                      AGE
knative-ingressgateway   LoadBalancer   100.70.219.81   35.233.41.212   80:32380/TCP,443:32390/TCP,32400:32400/TCP   4d
- Create a wildcard DNS entry in your custom domain to point to the above IP or CNAME:
*.knative.<my domain> == A 35.233.41.212
# or CNAME if you are on AWS
*.knative.<my domain> == CNAME a317a278525d111e89f272a164fd35fb-1510370581.eu-central-1.elb.amazonaws.com
- Adapt your Knative config-domain (set your domain in the data field):
kubectl --namespace knative-serving get configmaps config-domain --output yaml
apiVersion: v1
data:
  knative.<my domain>: ""
kind: ConfigMap
  name: config-domain
  namespace: knative-serving
What’s Next
Now that your cluster has Knative installed, you can see what Knative has to offer.
Deploy your first app with the Getting Started with Knative App Deployment guide.
Get started with Knative Eventing by walking through one of the Eventing Samples.
Install Cert-Manager if you want to use the automatic TLS cert provisioning feature.
Cleaning Up
Use the Gardener dashboard to delete your cluster, or execute the following with kubectl pointing to your garden-my-project.yaml kubeconfig:
kubectl --kubeconfig garden-my-project.yaml --namespace garden--my-project annotate shoot my-cluster confirmation.gardener.cloud/deletion=true

kubectl --kubeconfig garden-my-project.yaml --namespace garden--my-project delete shoot my-cluster
11 - Integrity and Immutability
Introduction
When transferring data among networked systems, trust is a central concern. In particular, when communicating over an untrusted medium such as the internet, it is critical to ensure the integrity and immutability of all the data a system operates on. Especially if you use Docker Engine to push and pull images (data) to a public registry.
This immutability offers you a guarantee that any and all containers that you instantiate will be absolutely identical at inception. Surprise surprise, deterministic operations.
A Lesson in Deterministic Ops
Docker Tags are about as reliable and disposable as this guy down here.

Seems simple enough. You have probably already deployed hundreds of YAML’s or started endless counts of Docker containers.
docker run --name mynginx1 -P -d nginx:1.13.9
or
apiVersion: apps/v1
kind: Deployment
metadata:
  name: rss-site
spec:
  replicas: 1
  selector:
    matchLabels:
      app: web
  template:
    metadata:
      labels:
        app: web
    spec:
      containers:
        - name: front-end
          image: nginx:1.13.9
          ports:
            - containerPort: 80
But Tags are mutable and humans are prone to error. Not a good combination. Here, we’ll dig into why the use of tags can be dangerous and how to deploy your containers across a pipeline and across environments with determinism in mind.
Let’s say that you want to ensure that whether it’s today or 5 years from now, that specific deployment uses the very same image that you have defined. Any updates or newer versions of an image should be executed as a new deployment. The solution: digest
A digest takes the place of the tag when pulling an image. For example, to pull the above image by digest, run the following command:
docker run --name mynginx1 -P -d nginx@sha256:4771d09578c7c6a65299e110b3ee1c0a2592f5ea2618d23e4ffe7a4cab1ce5de
You can now make sure that the same image is always loaded at every deployment. It doesn’t matter if the TAG of the image has been changed or not. This solves the problem of repeatability.
Content Trust
However, there’s an additionally hidden danger. It is possible for an attacker to replace a server image with another one infected with malware.

Docker Content trust gives you the ability to verify both the integrity and the publisher of all the data received from a registry over any channel.
Prior to version 1.8, Docker didn’t have a way to verify the authenticity of a server image. But in v1.8, a new feature called Docker Content Trust was introduced to automatically sign and verify the signature of a publisher.
So, as soon as a server image is downloaded, it is cross-checked with the signature of the publisher to see if someone tampered with it in any way. This solves the problem of trust.
In addition, you should scan all images for known vulnerabilities.
12 - Kubernetes Antipatterns
This HowTo covers common Kubernetes antipatterns that we have seen over the past months.
Running as Root User
Whenever possible, do not run containers as root user. One could be tempted to say that Kubernetes pods and nodes are well separated. Host and containers running on it share the same kernel. If a container is compromised, the root user in the container has full control over the underlying node.
Watch the very good presentation by Liz Rice at the KubeCon 2018
Use RUN groupadd -r anygroup && useradd -r -g anygroup myuser to create a group and add a user to it. Use the USER command to switch to this user. Note that you may also consider to provide an explicit UID/GID if required.
For example:
ARG GF_UID="500"
ARG GF_GID="500"

# add group & user
RUN groupadd -r -g $GF_GID appgroup && \
   useradd appuser -r -u $GF_UID -g appgroup

USER appuser
Store Data or Logs in Containers
Containers are ideal for stateless applications and should be transient. This means that no data or logs should be stored in the container, as they are lost when the container is closed. Use persistence volumes instead to persist data outside of containers. Using an ELK stack is another good option for storing and processing logs.
Using Pod IP Addresses
Each pod is assigned an IP address. It is necessary for pods to communicate with each other to build an application, e.g. an application must communicate with a database. Existing pods are terminated and new pods are constantly started. If you would rely on the IP address of a pod or container, you would need to update the application configuration constantly. This makes the application fragile.
Create services instead. They provide a logical name that can be assigned independently of the varying number and IP addresses of containers. Services are the basic concept for load balancing within Kubernetes.
More Than One Process in a Container
A docker file provides a CMD and ENTRYPOINT to start the image. CMD is often used around a script that makes a configuration and then starts the container. Do not try to start multiple processes with this script. It is important to consider the separation of concerns when creating docker images. Running multiple processes in a single pod makes managing your containers, collecting logs and updating each process more difficult.
You can split the image into multiple containers and manage them independently - even in one pod. Bear in mind that Kubernetes only monitors the process with PID=1. If more than one process is started within a container, then these no longer fall under the control of Kubernetes.
Creating Images in a Running Container
A new image can be created with the docker commit command. This is useful if changes have been made to the container and you want to persist them for later error analysis. However, images created like this are not reproducible and completely worthless for a CI/CD environment. Furthermore, another developer cannot recognize which components the image contains. Instead, always make changes to the docker file, close existing containers and start a new container with the updated image.
Saving Passwords in a docker Image 💀
Do not save passwords in a Docker file! They are in plain text and are checked into a repository. That makes them completely vulnerable even if you are using a private repository like the Artifactory.
Always use Secrets or ConfigMaps to provision passwords or inject them by mounting a persistent volume.
Using the ’latest’ Tag
Starting an image with tomcat is tempting. If no tags are specified, a container is started with the tomcat:latest image. This image may no longer be up to date and refer to an older version instead. Running a production application requires complete control of the environment with exact versions of the image.
Make sure you always use a tag or even better the sha256 hash of the image, e.g., tomcat@sha256:c34ce3c1fcc0c7431e1392cc3abd0dfe2192ffea1898d5250f199d3ac8d8720f.
Why Use the sha256 Hash?
Tags are not immutable and can be overwritten by a developer at any time. In this case you don’t have complete control over your image - which is bad.
Different Images per Environment
Don’t create different images for development, testing, staging and production environments. The image should be the source of truth and should only be created once and pushed to the repository. This image:tag should be used for different environments in the future.
Depend on Start Order of Pods
Applications often depend on containers being started in a certain order. For example, a database container must be up and running before an application can connect to it. The application should be resilient to such changes, as the db pod can be unreachable or restarted at any time. The application container should be able to handle such situations without terminating or crashing.
Additional Anti-Patterns and Patterns
In the community, vast experience has been collected to improve the stability and usability of Docker and Kubernetes.
Refer to Kubernetes Production Patterns for more information.
13 - Namespace Isolation
Overview
You can configure a NetworkPolicy to deny all the traffic from other namespaces while allowing all the traffic coming from the same namespace the pod was deployed into.
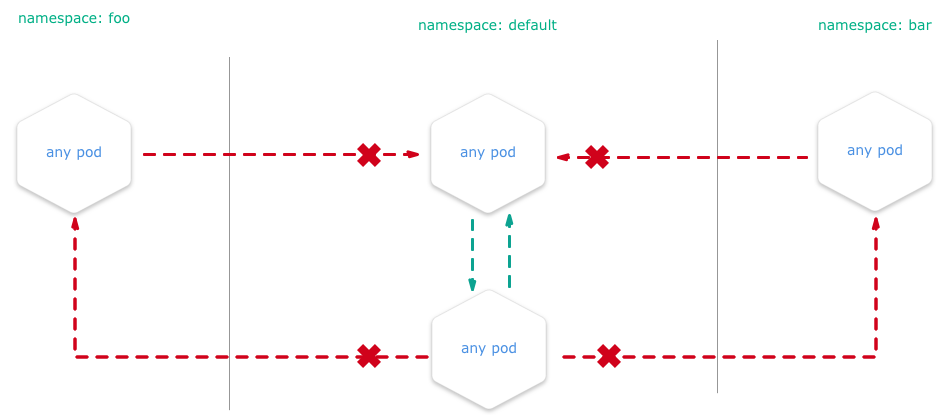
There are many reasons why you may chose to employ Kubernetes network policies:
- Isolate multi-tenant deployments
- Regulatory compliance
- Ensure containers assigned to different environments (e.g. dev/staging/prod) cannot interfere with each other
Kubernetes network policies are application centric compared to infrastructure/network centric standard firewalls. There are no explicit CIDRs or IP addresses used for matching source or destination IP’s. Network policies build up on labels and selectors which are key concepts of Kubernetes that are used to organize (for example, all DB tier pods of an app) and select subsets of objects.
Example
We create two nginx HTTP-Servers in two namespaces and block all traffic between the two namespaces. E.g. you are unable to get content from namespace1 if you are sitting in namespace2.
Setup the Namespaces
# create two namespaces for test purpose
kubectl create ns customer1
kubectl create ns customer2

# create a standard HTTP web server
kubectl run nginx --image=nginx --replicas=1 --port=80 -n=customer1
kubectl run nginx --image=nginx --replicas=1 --port=80 -n=customer2

# expose the port 80 for external access
kubectl expose deployment nginx --port=80 --type=NodePort -n=customer1
kubectl expose deployment nginx --port=80 --type=NodePort -n=customer2
Test Without NP
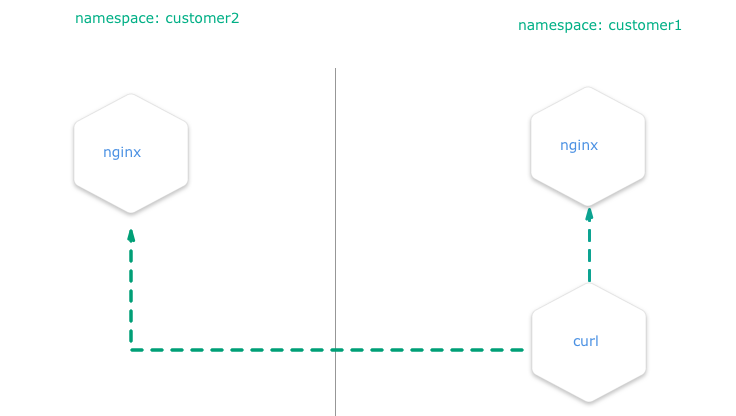
Create a pod with curl preinstalled inside the namespace customer1:
# create a "bash" pod in one namespace
kubectl run -i --tty client --image=tutum/curl -n=customer1
Try to curl the exposed nginx server to get the default index.html page. Execute this in the bash prompt of the pod created above.
# get the index.html from the nginx of the namespace "customer1" => success
curl http://nginx.customer1
# get the index.html from the nginx of the namespace "customer2" => success
curl http://nginx.customer2
Both calls are done in a pod within the namespace customer1 and both nginx servers are always reachable, no matter in what namespace.
Test with NP
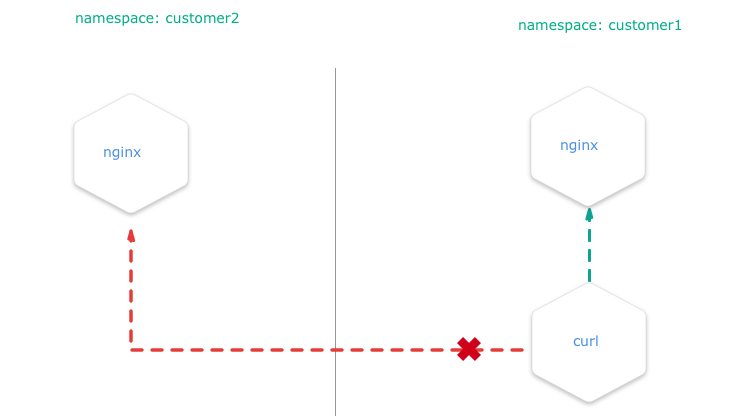
Install the NetworkPolicy from your shell:
apiVersion: networking.k8s.io/v1
kind: NetworkPolicy
metadata:
  name: deny-from-other-namespaces
spec:
  podSelector:
    matchLabels:
  ingress:
  - from:
    - podSelector: {}
- it applies the policy to ALL pods in the named namespace as the
spec.podSelector.matchLabelsis empty and therefore selects all pods. - it allows traffic from ALL pods in the named namespace, as
spec.ingress.from.podSelectoris empty and therefore selects all pods.
kubectl apply -f ./network-policy.yaml -n=customer1
kubectl apply -f ./network-policy.yaml -n=customer2
After this, curl http://nginx.customer2 shouldn’t work anymore if you are a service inside the namespace customer1 and vice versa.
Note
This policy, once applied, will also disable all external traffic to these pods. For example, you can create a service of type
LoadBalancerin namespacecustomer1that match the nginx pod. When you request the service by its<EXTERNAL_IP>:<PORT>, then the network policy that will deny the ingress traffic from the service and the request will time out.
Related Links
You can get more information on how to configure the NetworkPolicies at:
14 - Orchestration of Container Startup
Disclaimer
If an application depends on other services deployed separately, do not rely on a certain start sequence of containers. Instead, ensure that the application can cope with unavailability of the services it depends on.
Introduction
Kubernetes offers a feature called InitContainers to perform some tasks during a pod’s initialization.
In this tutorial, we demonstrate how to use InitContainers in order to orchestrate a starting sequence of multiple containers. The tutorial uses the example app url-shortener, which consists of two components:
- postgresql database
- webapp which depends on the postgresql database and provides two endpoints: create a short url from a given location and redirect from a given short URL to the corresponding target location
This app represents the minimal example where an application relies on another service or database. In this example, if the application starts before the database is ready, the application will fail as shown below:
$ kubectl logs webapp-958cf5567-h247n
time="2018-06-12T11:02:42Z" level=info msg="Connecting to Postgres database using: host=`postgres:5432` dbname=`url_shortener_db` username=`user`\n"
time="2018-06-12T11:02:42Z" level=fatal msg="failed to start: failed to open connection to database: dial tcp: lookup postgres on 100.64.0.10:53: no such host\n"


$ kubectl get po -w
NAME                                READY     STATUS    RESTARTS   AGE
webapp-958cf5567-h247n   0/1       Pending   0         0s
webapp-958cf5567-h247n   0/1       Pending   0         0s
webapp-958cf5567-h247n   0/1       ContainerCreating   0         0s
webapp-958cf5567-h247n   0/1       ContainerCreating   0         1s
webapp-958cf5567-h247n   0/1       Error     0         2s
webapp-958cf5567-h247n   0/1       Error     1         3s
webapp-958cf5567-h247n   0/1       CrashLoopBackOff   1         4s
webapp-958cf5567-h247n   0/1       Error     2         18s
webapp-958cf5567-h247n   0/1       CrashLoopBackOff   2         29s
webapp-958cf5567-h247n   0/1       Error     3         43s
webapp-958cf5567-h247n   0/1       CrashLoopBackOff   3         56s
If the restartPolicy is set to Always (default) in the yaml file, the application will continue to restart the pod with an exponential back-off delay in case of failure.
Using InitContaniner
To avoid such a situation, InitContainers can be defined, which are executed prior to the application container. If one of the InitContainers fails, the application container won’t be triggered.
apiVersion: apps/v1
kind: Deployment
metadata:
  name: webapp
spec:
  selector:
    matchLabels:
      app: webapp
  template:
    metadata:
      labels:
        app: webapp
    spec:
      initContainers:  # check if DB is ready, and only continue when true
      - name: check-db-ready
        image: postgres:9.6.5
        command: ['sh', '-c',  'until pg_isready -h postgres -p 5432;  do echo waiting for database; sleep 2; done;']
      containers:
      - image: xcoulon/go-url-shortener:0.1.0
        name: go-url-shortener
        env:
        - name: POSTGRES_HOST
          value: postgres
        - name: POSTGRES_PORT
          value: "5432"
        - name: POSTGRES_DATABASE
          value: url_shortener_db
        - name: POSTGRES_USER
          value: user
        - name: POSTGRES_PASSWORD
          value: mysecretpassword
        ports:
        - containerPort: 8080
In the above example, the InitContainers use the docker image postgres:9.6.5, which is different from the application container.
This also brings the advantage of not having to include unnecessary tools (e.g., pg_isready) in the application container.
With introduction of InitContainers, in case the database is not available yet, the pod startup will look like similarly to:
$ kubectl get po -w
NAME                                READY     STATUS    RESTARTS   AGE
nginx-deployment-5cc79d6bfd-t9n8h   1/1       Running   0          5d
privileged-pod                      1/1       Running   0          4d
webapp-fdcb49cbc-4gs4n   0/1       Pending   0         0s
webapp-fdcb49cbc-4gs4n   0/1       Pending   0         0s
webapp-fdcb49cbc-4gs4n   0/1       Init:0/1   0         0s
webapp-fdcb49cbc-4gs4n   0/1       Init:0/1   0         1s


$ kubectl  logs webapp-fdcb49cbc-4gs4n
Error from server (BadRequest): container "go-url-shortener" in pod "webapp-fdcb49cbc-4gs4n" is waiting to start: PodInitializing
15 - Out-Dated HTML and JS Files Delivered
Problem
After updating your HTML and JavaScript sources in your web application, the Kubernetes cluster delivers outdated versions - why?
Overview
By default, Kubernetes service pods are not accessible from the external network, but only from other pods within the same Kubernetes cluster.
The Gardener cluster has a built-in configuration for HTTP load balancing called Ingress, defining rules for external connectivity to Kubernetes services. Users who want external access to their Kubernetes services create an ingress resource that defines rules, including the URI path, backing service name, and other information. The Ingress controller can then automatically program a frontend load balancer to enable Ingress configuration.

Example Ingress Configuration
apiVersion: networking.k8s.io/v1beta1
kind: Ingress
metadata:
  name: vuejs-ingress
spec:
  rules:
  - host: test.ingress.<GARDENER-CLUSTER>.<GARDENER-PROJECT>.shoot.canary.k8s-hana.ondemand.com
    http:
      paths:
      - backend:
          serviceName: vuejs-svc
          servicePort: 8080
where:
- <GARDENER-CLUSTER>: The cluster name in the Gardener
- <GARDENER-PROJECT>: You project name in the Gardener
Diagnosing the Problem
The ingress controller we are using is NGINX. NGINX is a software load balancer, web server, and content cache built on top of open source NGINX.
NGINX caches the content as specified in the HTTP header. If the HTTP header is missing, it is assumed that the cache is forever and NGINX never updates the content in the stupidest case.
Solution
In general, you can avoid this pitfall with one of the solutions below:
- Use a cache buster + HTTP-Cache-Control (prefered)
- Use HTTP-Cache-Control with a lower retention period
- Disable the caching in the ingress (just for dev purposes)
Learning how to set the HTTP header or setup a cache buster is left to you, as an exercise for your web framework (e.g., Express/NodeJS, SpringBoot, …)
Here is an example on how to disable the cache control for your ingress, done with an annotation in your ingress YAML (during development).
---
apiVersion: networking.k8s.io/v1beta1
kind: Ingress
metadata:
  annotations:
    ingress.kubernetes.io/cache-enable: "false"
  name: vuejs-ingress
spec:
  rules:
  - host: test.ingress.<GARDENER-CLUSTER>.<GARDENER-PROJECT>.shoot.canary.k8s-hana.ondemand.com
    http:
      paths:
      - backend:
          serviceName: vuejs-svc
          servicePort: 8080
16 - Remove Committed Secrets in Github 💀
Overview
If you commit sensitive data, such as a kubeconfig.yaml or SSH key into a Git repository, you can remove it from
the history. To entirely remove unwanted files from a repository’s history you can use the git filter-branch command.
The git filter-branch command rewrites your repository’s history, which changes the SHAs for existing commits that you alter and any dependent commits. Changed commit SHAs may affect open pull requests in your repository. Merging or closing all open pull requests before removing files from your repository is recommended.
Warning
If someone has already checked out the repository, then of course they have the secret on their computer. So ALWAYS revoke the OAuthToken/Password or whatever it was immediately.
Purging a File from Your Repository’s History
Warning
If you run
git filter-branchafter stashing changes, you won’t be able to retrieve your changes with other stash commands. Before runninggit filter-branch, we recommend unstashing any changes you’ve made. To unstash the last set of changes you’ve stashed, rungit stash show -p | git apply -R. For more information, see Git Tools - Stashing and Cleaning.
To illustrate how git filter-branch works, we’ll show you how to remove your file with sensitive data from the history of your repository and add it to .gitignore to ensure that it is not accidentally re-committed.
1. Navigate into the repository’s working directory:
cd YOUR-REPOSITORY
2. Run the following command, replacing PATH-TO-YOUR-FILE-WITH-SENSITIVE-DATA with the path to the file you want to remove, not just its filename.
These arguments will:
- Force Git to process, but not check out, the entire history of every branch and tag
- Remove the specified file, as well as any empty commits generated as a result
- Overwrite your existing tags
git filter-branch --force --index-filter \
'git rm --cached --ignore-unmatch PATH-TO-YOUR-FILE-WITH-SENSITIVE-DATA' \
--prune-empty --tag-name-filter cat -- --all
3. Add your file with sensitive data to .gitignore to ensure that you don’t accidentally commit it again:
echo "YOUR-FILE-WITH-SENSITIVE-DATA" >> .gitignore
Double-check that you’ve removed everything you wanted to from your repository’s history, and that all of your branches are checked out. Once you’re happy with the state of your repository, continue to the next step.
4. Force-push your local changes to overwrite your GitHub repository, as well as all the branches you’ve pushed up:
git push origin --force --all
4. In order to remove the sensitive file from your tagged releases, you’ll also need to force-push against your Git tags:
git push origin --force --tags
Warning
Tell your collaborators to rebase, not merge, any branches they created off of your old (tainted) repository history. One merge commit could reintroduce some or all of the tainted history that you just went to the trouble of purging.
Related Links
17 - Using Prometheus and Grafana to Monitor K8s
Disclaimer
This post is meant to give a basic end-to-end description for deploying and using Prometheus and Grafana. Both applications offer a wide range of flexibility, which needs to be considered in case you have specific requirements. Such advanced details are not in the scope of this topic.
Introduction
Prometheus is an open-source systems monitoring and alerting toolkit for recording numeric time series. It fits both machine-centric monitoring as well as monitoring of highly dynamic service-oriented architectures. In a world of microservices, its support for multi-dimensional data collection and querying is a particular strength.
Prometheus is the second hosted project to graduate within CNCF.
The following characteristics make Prometheus a good match for monitoring Kubernetes clusters:
Pull-based Monitoring Prometheus is a pull-based monitoring system, which means that the Prometheus server dynamically discovers and pulls metrics from your services running in Kubernetes.
Labels Prometheus and Kubernetes share the same label (key-value) concept that can be used to select objects in the system.
Labels are used to identify time series and sets of label matchers can be used in the query language (PromQL) to select the time series to be aggregated.Exporters
There are many exporters available, which enable integration of databases or even other monitoring systems not already providing a way to export metrics to Prometheus. One prominent exporter is the so called node-exporter, which allows to monitor hardware and OS related metrics of Unix systems.Powerful Query Language The Prometheus query language PromQL lets the user select and aggregate time series data in real time. Results can either be shown as a graph, viewed as tabular data in the Prometheus expression browser, or consumed by external systems via the HTTP API.
Find query examples on Prometheus Query Examples.
One very popular open-source visualization tool not only for Prometheus is Grafana. Grafana is a metric analytics and visualization suite. It is popular for visualizing time series data for infrastructure and application analytics but many use it in other domains including industrial sensors, home automation, weather, and process control. For more information, see the Grafana Documentation.
Grafana accesses data via Data Sources. The continuously growing list of supported backends includes Prometheus.
Dashboards are created by combining panels, e.g., Graph and Dashlist.
In this example, we describe an End-To-End scenario including the deployment of Prometheus and a basic monitoring configuration as the one provided for Kubernetes clusters created by Gardener.
If you miss elements on the Prometheus web page when accessing it via its service URL https://<your K8s FQN>/api/v1/namespaces/<your-prometheus-namespace>/services/prometheus-prometheus-server:80/proxy, this is probably caused by a Prometheus issue - #1583. To workaround this issue, set up a port forward kubectl port-forward -n <your-prometheus-namespace> <prometheus-pod> 9090:9090 on your client and access the Prometheus UI from there with your locally installed web browser. This issue is not relevant in case you use the service type LoadBalancer.
Preparation
The deployment of Prometheus and Grafana is based on Helm charts.
Make sure to implement the Helm settings before deploying the Helm charts.
The Kubernetes clusters provided by Gardener use role based access control (RBAC). To authorize the Prometheus node-exporter to access hardware and OS relevant metrics of your cluster’s worker nodes, specific artifacts need to be deployed.
Bind the Prometheus service account to the garden.sapcloud.io:monitoring:prometheus cluster role by running the command
kubectl apply -f crbinding.yaml.
Content of crbinding.yaml
apiVersion: rbac.authorization.k8s.io/v1beta1
kind: ClusterRoleBinding
metadata:
  name: <your-prometheus-name>-server
roleRef:
  apiGroup: rbac.authorization.k8s.io
  kind: ClusterRole
  name: garden.sapcloud.io:monitoring:prometheus
subjects:
- kind: ServiceAccount
  name: <your-prometheus-name>-server
  namespace: <your-prometheus-namespace>
Deployment of Prometheus and Grafana
Only minor changes are needed to deploy Prometheus and Grafana based on Helm charts.
Copy the following configuration into a file called values.yaml and deploy Prometheus:
helm install <your-prometheus-name> --namespace <your-prometheus-namespace> stable/prometheus -f values.yaml
Typically, Prometheus and Grafana are deployed into the same namespace. There is no technical reason behind this, so feel free to choose different namespaces.
Content of values.yaml for Prometheus:
rbac:
  create: false # Already created in Preparation step
nodeExporter:
  enabled: false # The node-exporter is already deployed by default

server:
  global:
    scrape_interval: 30s
    scrape_timeout: 30s

serverFiles:
  prometheus.yml:
    rule_files:
      - /etc/config/rules
      - /etc/config/alerts
    scrape_configs:
    - job_name: 'kube-kubelet'
      honor_labels: false
      scheme: https

      tls_config:
      # This is needed because the kubelets' certificates are not generated
      # for a specific pod IP
        insecure_skip_verify: true
      bearer_token_file: /var/run/secrets/kubernetes.io/serviceaccount/token

      kubernetes_sd_configs:
      - role: node
      relabel_configs:
      - target_label: __metrics_path__
        replacement: /metrics
      - source_labels: [__meta_kubernetes_node_address_InternalIP]
        target_label: instance
      - action: labelmap
        regex: __meta_kubernetes_node_label_(.+)

    - job_name: 'kube-kubelet-cadvisor'
      honor_labels: false
      scheme: https

      tls_config:
      # This is needed because the kubelets' certificates are not generated
      # for a specific pod IP
        insecure_skip_verify: true
      bearer_token_file: /var/run/secrets/kubernetes.io/serviceaccount/token

      kubernetes_sd_configs:
      - role: node
      relabel_configs:
      - target_label: __metrics_path__
        replacement: /metrics/cadvisor
      - source_labels: [__meta_kubernetes_node_address_InternalIP]
        target_label: instance
      - action: labelmap
        regex: __meta_kubernetes_node_label_(.+)

    # Example scrape config for probing services via the Blackbox Exporter.
    #
    # Relabelling allows to configure the actual service scrape endpoint using the following annotations:
    #
    # * `prometheus.io/probe`: Only probe services that have a value of `true`
    - job_name: 'kubernetes-services'
      metrics_path: /probe
      params:
        module: [http_2xx]
      kubernetes_sd_configs:
        - role: service
      relabel_configs:
        - source_labels: [__meta_kubernetes_service_annotation_prometheus_io_probe]
          action: keep
          regex: true
        - source_labels: [__address__]
          target_label: __param_target
        - target_label: __address__
          replacement: blackbox
        - source_labels: [__param_target]
          target_label: instance
        - action: labelmap
          regex: __meta_kubernetes_service_label_(.+)
        - source_labels: [__meta_kubernetes_namespace]
          target_label: kubernetes_namespace
        - source_labels: [__meta_kubernetes_service_name]
          target_label: kubernetes_name
    # Example scrape config for pods
    #
    # Relabelling allows to configure the actual service scrape endpoint using the following annotations:
    #
    # * `prometheus.io/scrape`: Only scrape pods that have a value of `true`
    # * `prometheus.io/path`: If the metrics path is not `/metrics` override this.
    # * `prometheus.io/port`: Scrape the pod on the indicated port instead of the default of `9102`.
    - job_name: 'kubernetes-pods'
      kubernetes_sd_configs:
        - role: pod
      relabel_configs:
        - source_labels: [__meta_kubernetes_pod_annotation_prometheus_io_scrape]
          action: keep
          regex: true
        - source_labels: [__meta_kubernetes_pod_annotation_prometheus_io_path]
          action: replace
          target_label: __metrics_path__
          regex: (.+)
        - source_labels: [__address__, __meta_kubernetes_pod_annotation_prometheus_io_port]
          action: replace
          regex: (.+):(?:\d+);(\d+)
          replacement: ${1}:${2}
          target_label: __address__
        - action: labelmap
          regex: __meta_kubernetes_pod_label_(.+)
        - source_labels: [__meta_kubernetes_namespace]
          action: replace
          target_label: kubernetes_namespace
        - source_labels: [__meta_kubernetes_pod_name]
          action: replace
          target_label: kubernetes_pod_name
    # Scrape config for service endpoints.
    #
    # The relabeling allows the actual service scrape endpoint to be configured
    # via the following annotations:
    #
    # * `prometheus.io/scrape`: Only scrape services that have a value of `true`
    # * `prometheus.io/scheme`: If the metrics endpoint is secured then you will need
    # to set this to `https` & most likely set the `tls_config` of the scrape config.
    # * `prometheus.io/path`: If the metrics path is not `/metrics` override this.
    # * `prometheus.io/port`: If the metrics are exposed on a different port to the
    # service then set this appropriately.
    - job_name: 'kubernetes-service-endpoints'
      kubernetes_sd_configs:
        - role: endpoints
      relabel_configs:
        - source_labels: [__meta_kubernetes_service_annotation_prometheus_io_scrape]
          action: keep
          regex: true
        - source_labels: [__meta_kubernetes_service_annotation_prometheus_io_scheme]
          action: replace
          target_label: __scheme__
          regex: (https?)
        - source_labels: [__meta_kubernetes_service_annotation_prometheus_io_path]
          action: replace
          target_label: __metrics_path__
          regex: (.+)
        - source_labels: [__address__, __meta_kubernetes_service_annotation_prometheus_io_port]
          action: replace
          target_label: __address__
          regex: (.+)(?::\d+);(\d+)
          replacement: $1:$2
        - action: labelmap
          regex: __meta_kubernetes_service_label_(.+)
        - source_labels: [__meta_kubernetes_namespace]
          action: replace
          target_label: kubernetes_namespace
        - source_labels: [__meta_kubernetes_service_name]
          action: replace
          target_label: kubernetes_name # Add your additional configuration here...
Next, deploy Grafana. Since the deployment in this post is based on the Helm default values, the settings below are set explicitly in case the default changed.
Deploy Grafana via helm install grafana --namespace <your-prometheus-namespace> stable/grafana -f values.yaml. Here, the same namespace is chosen for Prometheus and for Grafana.
Content of values.yaml for Grafana:
server:
  ingress:
    enabled: false
  service:
    type: ClusterIP
Check the running state of the pods on the Kubernetes Dashboard or by running kubectl get pods -n <your-prometheus-namespace>. In case of errors, check the log files of the pod(s) in question.
The text output of Helm after the deployment of Prometheus and Grafana contains very useful information, e.g., the user and password of the Grafana Admin user. The credentials are stored as secrets in the namespace <your-prometheus-namespace> and could be decoded via kubectl get secret --namespace <my-grafana-namespace> grafana -o jsonpath="{.data.admin-password}" | base64 --decode ; echo.
Basic Functional Tests
To access the web UI of both applications, use port forwarding of port 9090.
Setup port forwarding for port 9090:
kubectl port-forward -n <your-prometheus-namespace> <your-prometheus-server-pod> 9090:9090
Open http://localhost:9090 in your web browser. Select Graph from the top tab and enter the following expressing to show the overall CPU usage for a server (see Prometheus Query Examples):
100 * (1 - avg by(instance)(irate(node_cpu{mode='idle'}[5m])))
This should show some data in a graph.
To show the same data in Grafana setup port forwarding for port 3000 for the Grafana pod and open the Grafana Web UI by opening http://localhost:3000 in a browser. Enter the credentials of the admin user.
Next, you need to enter the server name of your Prometheus deployment. This name is shown directly after the installation via helm.
Run
helm status <your-prometheus-name>
to find this name. Below, this server name is referenced by <your-prometheus-server-name>.
First, you need to add your Prometheus server as data source:
- Navigate to Dashboards → Data Sources
- Choose Add data source
- Enter:
Name:<your-prometheus-datasource-name>
Type: Prometheus
URL:http://<your-prometheus-server-name>
Access:proxy - Choose Save & Test
In case of failure, check the Prometheus URL in the Kubernetes Dashboard.
To add a Graph follow these steps:
- In the left corner, select Dashboards → New to create a new dashboard
- Select Graph to create a new graph
- Next, select the Panel Title → Edit
- Select your Prometheus Data Source in the drop down list
- Enter the expression
100 * (1 - avg by(instance)(irate(node_cpu{mode='idle'}[5m])))in the entry field A - Select the floppy disk symbol (Save) on top
Now you should have a very basic Prometheus and Grafana setup for your Kubernetes cluster.
As a next step you can implement monitoring for your applications by implementing the Prometheus client API.