This is the multi-page printable view of this section. Click here to print.
Monitor and Troubleshoot
1 - Analyzing Node Removal and Failures
Overview
Sometimes operators want to find out why a certain node got removed. This guide helps to identify possible causes. There are a few potential reasons why nodes can be removed:
- broken node: a node becomes unhealthy and machine-controller-manager terminates it in an attempt to replace the unhealthy node with a new one
- scale-down: cluster-autoscaler sees that a node is under-utilized and therefore scales down a worker pool
- node rolling: configuration changes to a worker pool (or cluster) require all nodes of one or all worker pools to be rolled and thus all nodes to be replaced. Some possible changes are:
- the K8s/OS version
- changing machine types
Helpful information can be obtained by using the logging stack. See Logging Stack for how to utilize the logging information in Gardener.
Find Out Whether the Node Was unhealthy
Check the Node Events
A good first indication on what happened to a node can be obtained from the node’s events. Events are scraped and ingested into the logging system, so they can be found in the explore tab of Grafana (make sure to select loki as datasource) with a query like {job="event-logging"} | unpack | object="Node/<node-name>" or find any event mentioning the node in question via a broader query like {job="event-logging"}|="<node-name>".
A potential result might reveal:
{"_entry":"Node ip-10-55-138-185.eu-central-1.compute.internal status is now: NodeNotReady","count":1,"firstTimestamp":"2023-04-05T12:02:08Z","lastTimestamp":"2023-04-05T12:02:08Z","namespace":"default","object":"Node/ip-10-55-138-185.eu-central-1.compute.internal","origin":"shoot","reason":"NodeNotReady","source":"node-controller","type":"Normal"}
Check machine-controller-manager Logs
If a node was getting unhealthy, the last conditions can be found in the logs of the machine-controller-manager by using a query like {pod_name=~"machine-controller-manager.*"}|="<node-name>".
Caveat: every node resource is backed by a corresponding machine resource managed by machine-controller-manager. Usually two corresponding node and machine resources have the same name with the exception of AWS. Here you first need to find with the above query the corresponding machine name, typically via a log like this
2023-04-05 12:02:08 {"log":"Conditions of Machine \"shoot--demo--cluster-pool-z1-6dffc-jh4z4\" with providerID \"aws:///eu-central-1/i-0a6ad1ca4c2e615dc\" and backing node \"ip-10-55-138-185.eu-central-1.compute.internal\" are changing","pid":"1","severity":"INFO","source":"machine_util.go:629"}
This reveals that node ip-10-55-138-185.eu-central-1.compute.internal is backed by machine shoot--demo--cluster-pool-z1-6dffc-jh4z4. On infrastructures other than AWS you can omit this step.
With the machine name at hand, now search for log entries with {pod_name=~"machine-controller-manager.*"}|="<machine-name>".
In case the node had failing conditions, you’d find logs like this:
2023-04-05 12:02:08 {"log":"Machine shoot--demo--cluster-pool-z1-6dffc-jh4z4 is unhealthy - changing MachineState to Unknown. Node conditions: [{Type:ClusterNetworkProblem Status:False LastHeartbeatTime:2023-04-05 11:58:39 +0000 UTC LastTransitionTime:2023-03-23 11:59:29 +0000 UTC Reason:NoNetworkProblems Message:no cluster network problems} ... {Type:Ready Status:Unknown LastHeartbeatTime:2023-04-05 11:55:27 +0000 UTC LastTransitionTime:2023-04-05 12:02:07 +0000 UTC Reason:NodeStatusUnknown Message:Kubelet stopped posting node status.}]","pid":"1","severity":"WARN","source":"machine_util.go:637"}
In the example above, the reason for an unhealthy node was that kubelet failed to renew its heartbeat. Typical reasons would be either a broken VM (that couldn’t execute kubelet anymore) or a broken network. Note that some VM terminations performed by the infrastructure provider are actually expected (e.g., scheduled events on AWS).
In both cases, the infrastructure provider might be able to provide more information on particular VM or network failures.
Whatever the failure condition might have been, if a node gets unhealthy, it will be terminated by machine-controller-manager after the machineHealthTimeout has elapsed (this parameter can be configured in your shoot spec).
Check the Node Logs
For each node the kernel and kubelet logs, as well as a few others, are scraped and can be queried with this query {nodename="<node-name>"}
This might reveal OS specific issues or, in the absence of any logs (e.g., after the node went unhealthy), might indicate a network disruption or sudden VM termination. Note that some VM terminations performed by the infrastructure provider are actually expected (e.g., scheduled events on AWS).
Infrastructure providers might be able to provide more information on particular VM failures in such cases.
Check the Network Problem Detector Dashboard
If your Gardener installation utilizes gardener-extension-shoot-networking-problemdetector, you can check the dashboard named “Network Problem Detector” in Grafana for hints on network issues on the node of interest.
Scale-Down
In general, scale-downs are managed by the cluster-autoscaler, its logs can be found with the query {container_name="cluster-autoscaler"}.
Attempts to remove a node can be found with the query {container_name="cluster-autoscaler"}|="Scale-down: removing empty node"
If a scale-down has caused disruptions in your workload, consider protecting your workload by adding PodDisruptionBudgets (see the autoscaler FAQ for more options).
Node Rolling
Node rolling can be caused by, e.g.:
- change of the K8s minor version of the cluster or a worker pool
- change of the OS version of the cluster or a worker pool
- change of the disk size/type or machine size/type of a worker pool
- change of node labels
Changes like the above are done by altering the shoot specification and thus are recorded in the external auditlog system that is configured for the garden cluster.
2 - Get a Shell to a Gardener Shoot Worker Node
Overview
To troubleshoot certain problems in a Kubernetes cluster, operators need access to the host of the Kubernetes node. This can be required if a node misbehaves or fails to join the cluster in the first place.
With access to the host, it is for instance possible to check the kubelet logs and interact with common tools such as systemctl and journalctl.
The first section of this guide explores options to get a shell to the node of a Gardener Kubernetes cluster. The options described in the second section do not rely on Kubernetes capabilities to get shell access to a node and thus can also be used if an instance failed to join the cluster.
This guide only covers how to get access to the host, but does not cover troubleshooting methods.
- Overview
- Get a Shell to an Operational Cluster Node
- SSH Access to a Node That Failed to Join the Cluster
- Cleanup
Get a Shell to an Operational Cluster Node
The following describes four different approaches to get a shell to an operational Shoot worker node. As a prerequisite to troubleshooting a Kubernetes node, the node must have joined the cluster successfully and be able to run a pod. All of the described approaches involve scheduling a pod with root permissions and mounting the root filesystem.
Gardener Dashboard
Prerequisite: the terminal feature is configured for the Gardener dashboard.
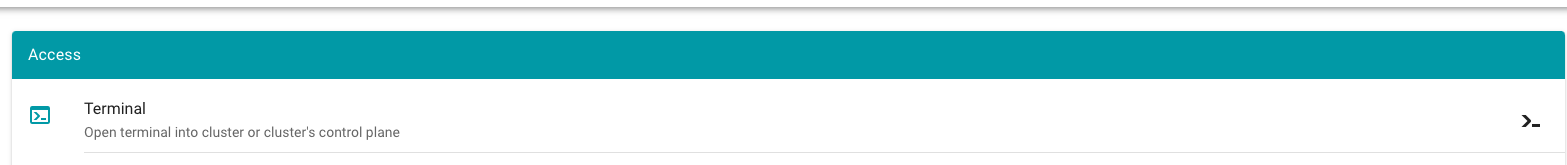
- Navigate to the cluster overview page and find the
Terminalin theAccesstile.
Select the target Cluster (Garden, Seed / Control Plane, Shoot cluster) depending on the requirements and access rights (only certain users have access to the Seed Control Plane).
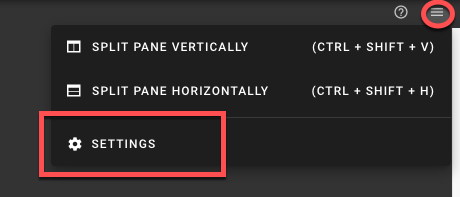
- To open the terminal configuration, interact with the top right-hand corner of the screen.
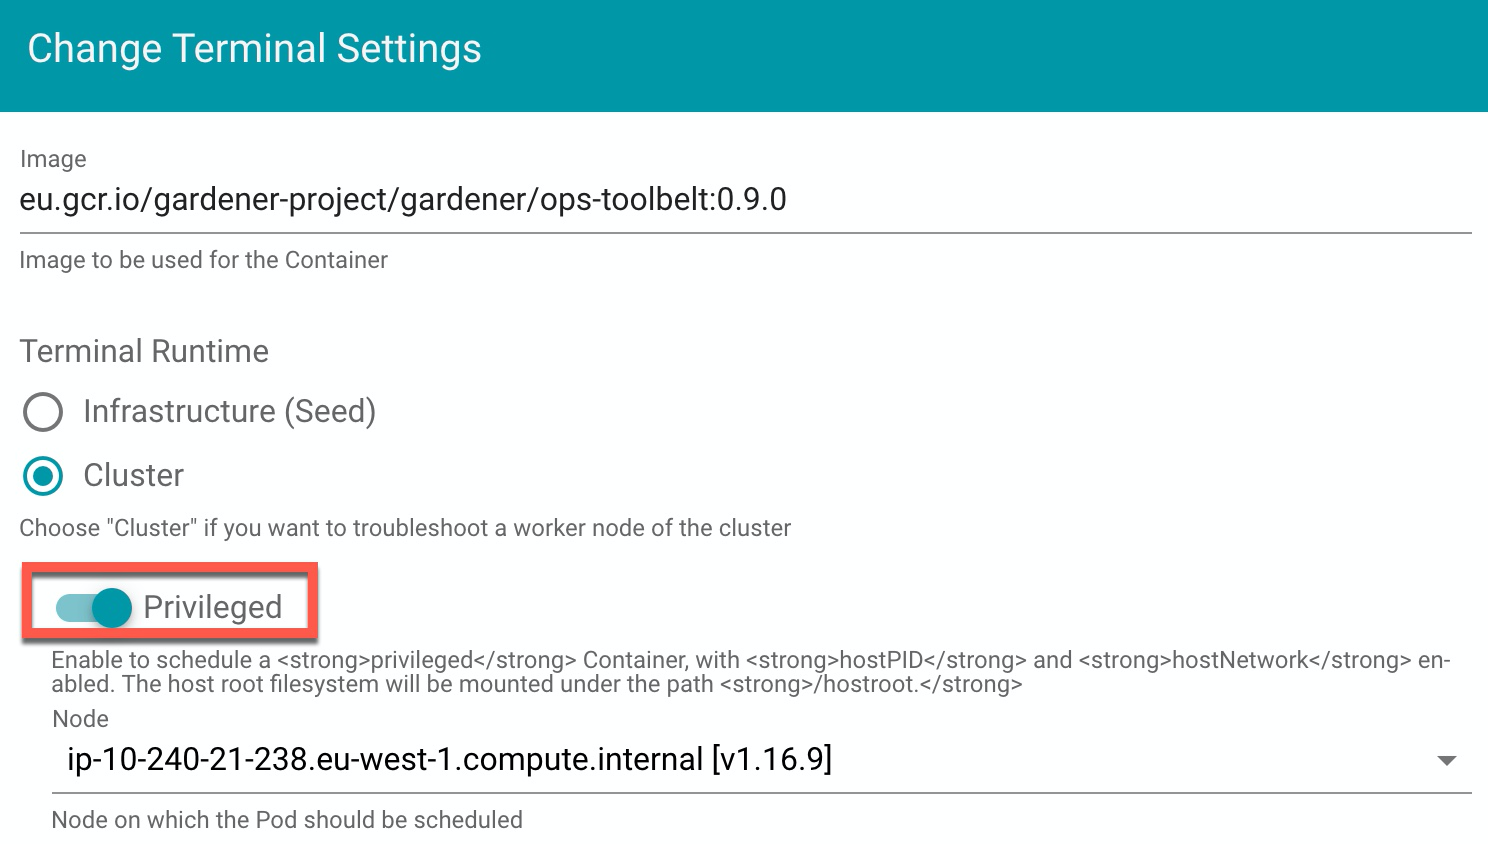
- Set the Terminal Runtime to “Privileged”. Also, specify the target node from the drop-down menu.
Result
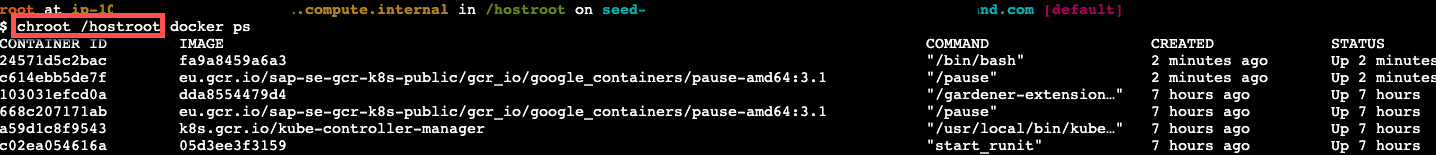
The Dashboard then schedules a pod and opens a shell session to the node.
To get access to the common binaries installed on the host, prefix the command with chroot /hostroot. Note that the path depends on where the root path is mounted in the container. In the default image used by the Dashboard, it is under /hostroot.
Gardener Ops Toolbelt
Prerequisite: kubectl is available.
The Gardener ops-toolbelt can be used as a convenient way to deploy a root pod to a node. The pod uses an image that is bundled with a bunch of useful troubleshooting tools. This is also the same image that is used by default when using the Gardener Dashboard terminal feature as described in the previous section.
The easiest way to use the Gardener ops-toolbelt is to execute the ops-pod script in the hacks folder. To get root shell access to a node, execute the aforementioned script by supplying the target node name as an argument:
<path-to-ops-toolbelt-repo>/hacks/ops-pod <target-node>
Custom Root Pod
Alternatively, a pod can be assigned to a target node and a shell can be opened via standard Kubernetes means. To enable root access to the node, the pod specification requires proper securityContext and volume properties.
For instance, you can use the following pod manifest, after changing
apiVersion: v1
kind: Pod
metadata:
  name: privileged-pod
  namespace: default
spec:
  nodeSelector:
    kubernetes.io/hostname: <target-node-name>
  containers:
  - name: busybox
    image: busybox
    stdin: true
    securityContext:
      privileged: true
    volumeMounts:
    - name: host-root-volume
      mountPath: /host
      readOnly: true
  volumes:
  - name: host-root-volume
    hostPath:
      path: /
  hostNetwork: true
  hostPID: true
  restartPolicy: Never
SSH Access to a Node That Failed to Join the Cluster
This section explores two options that can be used to get SSH access to a node that failed to join the cluster. As it is not possible to schedule a pod on the node, the Kubernetes-based methods explored so far cannot be used in this scenario.
Additionally, Gardener typically provisions worker instances in a private subnet of the VPC, hence - there is no public IP address that could be used for direct SSH access.
For this scenario, cloud providers typically have extensive documentation (e.g., AWS & GCP and in some cases tooling support). However, these approaches are mostly cloud provider specific, require interaction via their CLI and API or sometimes the installation of a cloud provider specific agent on the node.
Alternatively, gardenctl can be used providing a cloud provider agnostic and out-of-the-box support to get ssh access to an instance in a private subnet. Currently gardenctl supports AWS, GCP, Openstack, Azure and Alibaba Cloud.
Identifying the Problematic Instance
First, the problematic instance has to be identified. In Gardener, worker pools can be created in different cloud provider regions, zones, and accounts.
The instance would typically show up as successfully started / running in the cloud provider dashboard or API and it is not immediately obvious which one has a problem. Instead, we can use the Gardener API / CRDs to obtain the faulty instance identifier in a cloud-agnostic way.
Gardener uses the Machine Controller Manager to create the Shoot worker nodes. For each worker node, the Machine Controller Manager creates a Machine CRD in the Shoot namespace in the respective Seed cluster. Usually the problematic instance can be identified, as the respective Machine CRD has status pending.
The instance / node name can be obtained from the Machine .status field:
kubectl get machine <machine-name> -o json | jq -r .status.node
This is all the information needed to go ahead and use gardenctl ssh to get a shell to the node. In addition, the used cloud provider, the specific identifier of the instance, and the instance region can be identified from the Machine CRD.
Get the identifier of the instance via:
kubectl get machine <machine-name> -o json | jq -r .spec.providerID // e.g aws:///eu-north-1/i-069733c435bdb4640
The identifier shows that the instance belongs to the cloud provider aws with the ec2 instance-id i-069733c435bdb4640 in region eu-north-1.
To get more information about the instance, check out the MachineClass (e.g., AWSMachineClass) that is associated with each Machine CRD in the Shoot namespace of the Seed cluster.
The AWSMachineClass contains the machine image (ami), machine-type, iam information, network-interfaces, subnets, security groups and attached volumes.
Of course, the information can also be used to get the instance with the cloud provider CLI / API.
gardenctl ssh
Using the node name of the problematic instance, we can use the gardenctl ssh command to get SSH access to the cloud provider instance via an automatically set up bastion host. gardenctl takes care of spinning up the bastion instance, setting up the SSH keys, ports and security groups and opens a root shell on the target instance. After the SSH session has ended, gardenctl deletes the created cloud provider resources.
Use the following commands:
- First, target a Garden cluster containing all the Shoot definitions.
gardenctl target garden <target-garden>
- Target an available Shoot by name. This sets up the context, configures the
kubeconfigfile of the Shoot cluster and downloads the cloud provider credentials. Subsequent commands will execute in this context.
gardenctl target shoot <target-shoot>
- This uses the cloud provider credentials to spin up the bastion and to open a shell on the target instance.
gardenctl ssh <target-node>
SSH with a Manually Created Bastion on AWS
In case you are not using gardenctl or want to control the bastion instance yourself, you can also manually set it up.
The steps described here are generally the same as those used by gardenctl internally.
Despite some cloud provider specifics, they can be generalized to the following list:
- Open port 22 on the target instance.
- Create an instance / VM in a public subnet (the bastion instance needs to have a public IP address).
- Set-up security groups and roles, and open port 22 for the bastion instance.
The following diagram shows an overview of how the SSH access to the target instance works:
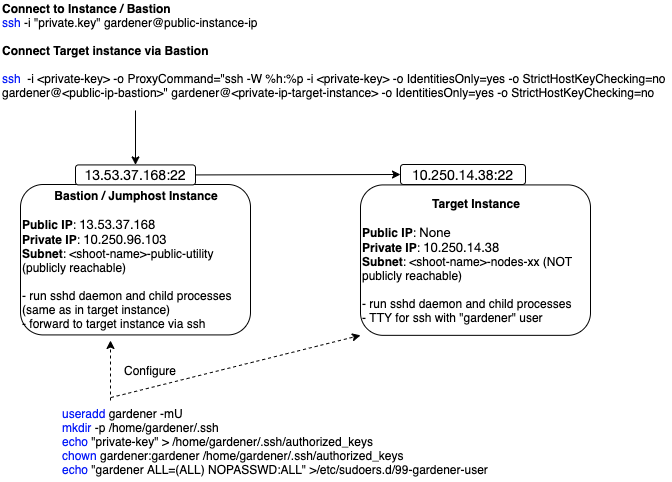
This guide demonstrates the setup of a bastion on AWS.
Prerequisites:
The
AWS CLIis set up.Obtain target
instance-id(see Identifying the Problematic Instance).Obtain the VPC ID the Shoot resources are created in. This can be found in the
InfrastructureCRD in theShootnamespace in theSeed.Make sure that port 22 on the target instance is open (default for Gardener deployed instances).
- Extract security group via:
aws ec2 describe-instances --instance-ids <instance-id>- Check for rule that allows inbound connections on port 22:
aws ec2 describe-security-groups --group-ids=<security-group-id>- If not available, create the rule with the following comamnd:
aws ec2 authorize-security-group-ingress --group-id <security-group-id> --protocol tcp --port 22 --cidr 0.0.0.0/0
Create the Bastion Security Group
- The common name of the security group is
<shoot-name>-bsg. Create the security group:
aws ec2 create-security-group --group-name <bastion-security-group-name> --description ssh-access --vpc-id <VPC-ID>
- Optionally, create identifying tags for the security group:
aws ec2 create-tags --resources <bastion-security-group-id> --tags Key=component,Value=<tag>
- Create a permission in the bastion security group that allows ssh access on port 22:
aws ec2 authorize-security-group-ingress --group-id <bastion-security-group-id> --protocol tcp --port 22 --cidr 0.0.0.0/0
- Create an IAM role for the bastion instance with the name
<shoot-name>-bastions:
aws iam create-role --role-name <shoot-name>-bastions
The content should be:
{
"Version": "2012-10-17",
"Statement": [
    {
        "Effect": "Allow",
        "Action": [
            "ec2:DescribeRegions"
        ],
        "Resource": [
            "*"
        ]
    }
]
}
- Create the instance profile and name it
<shoot-name>-bastions:
aws iam create-instance-profile --instance-profile-name <name>
- Add the created role to the instance profile:
aws iam add-role-to-instance-profile --instance-profile-name <instance-profile-name> --role-name <role-name>
Create the Bastion Instance
Next, in order to be able to ssh into the bastion instance, the instance has to be set up with a user with a public ssh key.
Create a user gardener that has the same Gardener-generated public ssh key as the target instance.
- First, we need to get the public part of the
Shootssh-key. The ssh-key is stored in a secret in the the project namespace in the Garden cluster. The name is:<shoot-name>-ssh-publickey. Get the key via:
kubectl get secret aws-gvisor.ssh-keypair -o json | jq -r .data.\"id_rsa.pub\"
- A script handed over as
user-datato the bastionec2instance, can be used to create thegardeneruser and add the ssh-key. For your convenience, you can use the following script to generate theuser-data.
#!/bin/bash -eu
saveUserDataFile () {
  ssh_key=$1

cat > gardener-bastion-userdata.sh <<EOF
#!/bin/bash -eu
id gardener || useradd gardener -mU
mkdir -p /home/gardener/.ssh
echo "$ssh_key" > /home/gardener/.ssh/authorized_keys
chown gardener:gardener /home/gardener/.ssh/authorized_keys
echo "gardener ALL=(ALL) NOPASSWD:ALL" >/etc/sudoers.d/99-gardener-user
EOF
}


if [ -p /dev/stdin ]; then
    read -r input
    cat | saveUserDataFile "$input"
else
    pbpaste | saveUserDataFile "$input"
fi
- Use the script by handing-over the public ssh-key of the
Shootcluster:
kubectl get secret aws-gvisor.ssh-keypair -o json | jq -r .data.\"id_rsa.pub\" | ./generate-userdata.sh
This generates a file called gardener-bastion-userdata.sh in the same directory containing the user-data.
- The following information is needed to create the bastion instance:
bastion-IAM-instance-profile-name
- Use the created instance profile with the name <shoot-name>-bastions
image-id
- It is possible to use the same image-id as the one used for the target instance (or any other image). Has cloud provider specific format (AWS: ami).
ssh-public-key-name
- This is the ssh key pair already created in the Shoot's cloud provider account by Gardener during the `Infrastructure` CRD reconciliation.
- The name is usually: `<shoot-name>-ssh-publickey`
subnet-id
- Choose a subnet that is attached to an Internet Gateway and NAT Gateway (bastion instance must have a public IP).
- The Gardener created public subnet with the name <shoot-name>-public-utility-<xy> can be used.
Please check the created subnets with the cloud provider.
bastion-security-group-id
- Use the id of the created bastion security group.
file-path-to-userdata
- Use the filepath to the user-data file generated in the previous step.
bastion-instance-name- Optionaly, you can tag the instance.
- Usually
<shoot-name>-bastions
- Create the bastion instance via:
ec2 run-instances --iam-instance-profile Name=<bastion-IAM-instance-profile-name> --image-id <image-id> --count 1 --instance-type t3.nano --key-name <ssh-public-key-name> --security-group-ids <bastion-security-group-id> --subnet-id <subnet-id> --associate-public-ip-address --user-data <file-path-to-userdata> --tag-specifications ResourceType=instance,Tags=[{Key=Name,Value=<bastion-instance-name>},{Key=component,Value=<mytag>}] ResourceType=volume,Tags=[{Key=component,Value=<mytag>}]"
Capture the instance-id from the response and wait until the ec2 instance is running and has a public IP address.
Connecting to the Target Instance
- Save the private key of the ssh-key-pair in a temporary local file for later use:
umask 077

kubectl get secret <shoot-name>.ssh-keypair -o json | jq -r .data.\"id_rsa\" | base64 -d > id_rsa.key
- Use the private ssh key to ssh into the bastion instance:
ssh -i <path-to-private-key> gardener@<public-bastion-instance-ip>
- If that works, connect from your local terminal to the target instance via the bastion:
ssh -i <path-to-private-key> -o ProxyCommand="ssh -W %h:%p -i <private-key> -o IdentitiesOnly=yes -o StrictHostKeyChecking=no gardener@<public-ip-bastion>" gardener@<private-ip-target-instance> -o IdentitiesOnly=yes -o StrictHostKeyChecking=no
Cleanup
Do not forget to cleanup the created resources. Otherwise Gardener will eventually fail to delete the Shoot.
3 - How to Debug a Pod
Introduction
Kubernetes offers powerful options to get more details about startup or runtime failures of pods as e.g. described in Application Introspection and Debugging or Debug Pods and Replication Controllers.
In order to identify pods with potential issues, you could, e.g., run kubectl get pods --all-namespaces | grep -iv Running to filter out the pods which are not in the state Running. One of frequent error state is CrashLoopBackOff, which tells that a pod crashes right after the start. Kubernetes then tries to restart the pod again, but often the pod startup fails again.
Here is a short list of possible reasons which might lead to a pod crash:
- Error during image pull caused by e.g. wrong/missing secrets or wrong/missing image
- The app runs in an error state caused e.g. by missing environmental variables (ConfigMaps) or secrets
- Liveness probe failed
- Too high resource consumption (memory and/or CPU) or too strict quota settings
- Persistent volumes can’t be created/mounted
- The container image is not updated
Basically, the commands kubectl logs ... and kubectl describe ... with different parameters are used to get more detailed information. By calling e.g. kubectl logs --help you can get more detailed information about the command and its parameters.
In the next sections you’ll find some basic approaches to get some ideas what went wrong.
Remarks:
- Even if the pods seem to be running, as the status
Runningindicates, a high counter of theRestartsshows potential problems - You can get a good overview of the troubleshooting process with the interactive tutorial Troubleshooting with Kubectl available which explains basic debugging activities
- The examples below are deployed into the namespace
default. In case you want to change it, use the optional parameter--namespace <your-namespace>to select the target namespace. The examples require a Kubernetes release ≥ 1.8.
Prerequisites
Your deployment was successful (no logical/syntactical errors in the manifest files), but the pod(s) aren’t running.
Error Caused by Wrong Image Name
Start by running kubectl describe pod <your-pod> <your-namespace> to get detailed information about the pod startup.
In the Events section, you should get an error message like Failed to pull image ... and Reason: Failed. The pod is in state ImagePullBackOff.
The example below is based on a demo in the Kubernetes documentation. In all examples, the default namespace is used.
First, perform a cleanup with:
kubectl delete pod termination-demo
Next, create a resource based on the yaml content below:
apiVersion: v1
kind: Pod
metadata:
  name: termination-demo
spec:
  containers:
  - name: termination-demo-container
    image: debiann
    command: ["/bin/sh"]
    args: ["-c", "sleep 10 && echo Sleep expired > /dev/termination-log"]
kubectl describe pod termination-demo lists in the Event section the content
Events:
  FirstSeen	LastSeen	Count	From							SubObjectPath					Type		Reason			Message
  ---------	--------	-----	----							-------------					--------	------			-------
  2m		2m		1	default-scheduler											Normal		Scheduled		Successfully assigned termination-demo to ip-10-250-17-112.eu-west-1.compute.internal
  2m		2m		1	kubelet, ip-10-250-17-112.eu-west-1.compute.internal							Normal		SuccessfulMountVolume	MountVolume.SetUp succeeded for volume "default-token-sgccm"
  2m		1m		4	kubelet, ip-10-250-17-112.eu-west-1.compute.internal	spec.containers{termination-demo-container}	Normal		Pulling			pulling image "debiann"
  2m		1m		4	kubelet, ip-10-250-17-112.eu-west-1.compute.internal	spec.containers{termination-demo-container}	Warning		Failed			Failed to pull image "debiann": rpc error: code = Unknown desc = Error: image library/debiann:latest not found
  2m		54s		10	kubelet, ip-10-250-17-112.eu-west-1.compute.internal							Warning		FailedSync		Error syncing pod
  2m		54s		6	kubelet, ip-10-250-17-112.eu-west-1.compute.internal	spec.containers{termination-demo-container}	Normal		BackOff			Back-off pulling image "debiann"
The error message with Reason: Failed tells you that there is an error during pulling the image. A closer look at the image name indicates a misspelling.
The App Runs in an Error State Caused, e.g., by Missing Environmental Variables (ConfigMaps) or Secrets
This example illustrates the behavior in the case when the app expects environment variables but the corresponding Kubernetes artifacts are missing.
First, perform a cleanup with:
kubectl delete deployment termination-demo
kubectl delete configmaps app-env
Next, deploy the following manifest:
apiVersion: apps/v1beta2
kind: Deployment
metadata:
  name: termination-demo
  labels:
     app: termination-demo
spec:
  replicas: 1
  selector:
    matchLabels:
      app: termination-demo
  template:
    metadata:
      labels:
        app: termination-demo
    spec:
      containers:
      - name: termination-demo-container
        image: debian
        command: ["/bin/sh"]
        args: ["-c", "sed \"s/foo/bar/\" < $MYFILE"]
Now, the command kubectl get pods lists the pod termination-demo-xxx in the state Error or CrashLoopBackOff. The command kubectl describe pod termination-demo-xxx tells you that there is no error during startup but gives no clue about what caused the crash.
Events:
  FirstSeen	LastSeen	Count	From							SubObjectPath					Type		Reason		Message
  ---------	--------	-----	----							-------------					--------	------		-------
  19m		19m		1	default-scheduler											Normal		Scheduled	Successfully assigned termination-demo-5fb484867d-xz2x9 to ip-10-250-17-112.eu-west-1.compute.internal
  19m		19m		1	kubelet, ip-10-250-17-112.eu-west-1.compute.internal							Normal		SuccessfulMountVolume	MountVolume.SetUp succeeded for volume "default-token-sgccm"
  19m		19m		4	kubelet, ip-10-250-17-112.eu-west-1.compute.internal	spec.containers{termination-demo-container}	Normal		Pulling		pulling image "debian"
  19m		19m		4	kubelet, ip-10-250-17-112.eu-west-1.compute.internal	spec.containers{termination-demo-container}	Normal		Pulled		Successfully pulled image "debian"
  19m		19m		4	kubelet, ip-10-250-17-112.eu-west-1.compute.internal	spec.containers{termination-demo-container}	Normal		Created		Created container
  19m		19m		4	kubelet, ip-10-250-17-112.eu-west-1.compute.internal	spec.containers{termination-demo-container}	Normal		Started		Started container
  19m		14m		24	kubelet, ip-10-250-17-112.eu-west-1.compute.internal	spec.containers{termination-demo-container}	Warning		BackOff		Back-off restarting failed container
  19m		4m		69	kubelet, ip-10-250-17-112.eu-west-1.compute.internal							Warning		FailedSync	Error syncing pod
The command kubectl get logs termination-demo-xxx gives access to the output, the application writes on stderr and stdout. In this case, you should get an output similar to:
/bin/sh: 1: cannot open : No such file
So you need to have a closer look at the application. In this case, the environmental variable MYFILE is missing. To fix this
issue, you could e.g. add a ConfigMap to your deployment as is shown in the manifest listed below:
apiVersion: v1
kind: ConfigMap
metadata:
  name: app-env
data:
  MYFILE: "/etc/profile"
---
apiVersion: apps/v1beta2
kind: Deployment
metadata:
  name: termination-demo
  labels:
     app: termination-demo
spec:
  replicas: 1
  selector:
    matchLabels:
      app: termination-demo
  template:
    metadata:
      labels:
        app: termination-demo
    spec:
      containers:
      - name: termination-demo-container
        image: debian
        command: ["/bin/sh"]
        args: ["-c", "sed \"s/foo/bar/\" < $MYFILE"]
        envFrom:
        - configMapRef:
            name: app-env
Note that once you fix the error and re-run the scenario, you might still see the pod in a CrashLoopBackOff status.
It is because the container finishes the command sed ... and runs to completion. In order to keep the container in a Running status, a long running task is required, e.g.:
apiVersion: v1
kind: ConfigMap
metadata:
  name: app-env
data:
  MYFILE: "/etc/profile"
  SLEEP: "5"
---
apiVersion: apps/v1beta2
kind: Deployment
metadata:
  name: termination-demo
  labels:
     app: termination-demo
spec:
  replicas: 1
  selector:
    matchLabels:
      app: termination-demo
  template:
    metadata:
      labels:
        app: termination-demo
    spec:
      containers:
      - name: termination-demo-container
        image: debian
        command: ["/bin/sh"]
        # args: ["-c", "sed \"s/foo/bar/\" < $MYFILE"]
        args: ["-c", "while true; do sleep $SLEEP; echo sleeping; done;"]
        envFrom:
        - configMapRef:
            name: app-env
Too High Resource Consumption (Memory and/or CPU) or Too Strict Quota Settings
You can optionally specify the amount of memory and/or CPU your container gets during runtime. In case these settings are missing, the default requests settings are taken: CPU: 0m (in Milli CPU) and RAM: 0Gi, which indicate no other limits other than the ones of the node(s) itself. For more details, e.g. about how to configure limits, see Configure Default Memory Requests and Limits for a Namespace.
In case your application needs more resources, Kubernetes distinguishes between requests and limit settings: requests specify the guaranteed amount of resource, whereas limit tells Kubernetes the maximum amount of resource the container might need. Mathematically, both settings could be described by the relation 0 <= requests <= limit. For both settings you need to consider the total amount of resources your nodes provide. For a detailed description of the concept, see Resource Quality of Service in Kubernetes.
Use kubectl describe nodes to get a first overview of the resource consumption in your cluster. Of special interest are the figures indicating the amount of CPU and Memory Requests at the bottom of the output.
The next example demonstrates what happens in case the CPU request is too high in order to be managed by your cluster.
First, perform a cleanup with:
kubectl delete deployment termination-demo
kubectl delete configmaps app-env
Next, adapt the cpu below in the yaml below to be slightly higher than the remaining CPU resources in your cluster and deploy this manifest. In this example, 600m (milli CPUs) are requested in a Kubernetes system with a single 2 core worker node which results in an error message.
apiVersion: apps/v1beta2
kind: Deployment
metadata:
  name: termination-demo
  labels:
     app: termination-demo
spec:
  replicas: 1
  selector:
    matchLabels:
      app: termination-demo
  template:
    metadata:
      labels:
        app: termination-demo
    spec:
      containers:
      - name: termination-demo-container
        image: debian
        command: ["/bin/sh"]
        args: ["-c", "sleep 10 && echo Sleep expired > /dev/termination-log"]
        resources:
          requests:
            cpu: "600m"
The command kubectl get pods lists the pod termination-demo-xxx in the state Pending. More details on why this happens could be found by using the command kubectl describe pod termination-demo-xxx:
$ kubectl describe po termination-demo-fdb7bb7d9-mzvfw
Name:           termination-demo-fdb7bb7d9-mzvfw
Namespace:      default
...
Containers:
  termination-demo-container:
    Image:      debian
    Port:       <none>
    Host Port:  <none>
    Command:
      /bin/sh
    Args:
      -c
      sleep 10 && echo Sleep expired > /dev/termination-log
    Requests:
      cpu:        6
    Environment:  <none>
    Mounts:
      /var/run/secrets/kubernetes.io/serviceaccount from default-token-t549m (ro)
Conditions:
  Type           Status
  PodScheduled   False
Events:
  Type     Reason            Age               From               Message
  ----     ------            ----              ----               -------
  Warning  FailedScheduling  9s (x7 over 40s)  default-scheduler  0/2 nodes are available: 2 Insufficient cpu.
You can find more details in:
Remarks:
- This example works similarly when specifying a too high request for memory
- In case you configured an autoscaler range when creating your Kubernetes cluster, another worker node will be spinned up automatically if you didn’t reach the maximum number of worker nodes
- In case your app is running out of memory (the memory settings are too small), you will typically find an
OOMKilled(Out Of Memory) message in theEventssection of thekubectl describe pod ...output
The Container Image Is Not Updated
You applied a fix in your app, created a new container image and pushed it into your container repository. After redeploying your Kubernetes manifests, you expected to get the updated app, but the same bug is still in the new deployment present.
This behavior is related to how Kubernetes decides whether to pull a new docker image or to use the cached one.
In case you didn’t change the image tag, the default image policy IfNotPresent tells Kubernetes to use the cached image (see Images).
As a best practice, you should not use the tag latest and change the image tag in case you changed anything in your image (see Configuration Best Practices).
For more information, see Container Image Not Updating.
Related Links
- Application Introspection and Debugging
- Debug Pods and Replication Controllers
- Logging Architecture
- Configure Default Memory Requests and Limits for a Namespace
- Managing Compute Resources for Containters
- Resource Quality of Service in Kubernetes
- Interactive Tutorial Troubleshooting with Kubectl
- Images
- Kubernetes Best Practices
4 - tail -f /var/log/my-application.log
Problem
One thing that always bothered me was that I couldn’t get logs of several pods at once with kubectl. A simple tail -f <path-to-logfile> isn’t possible at all. Certainly, you can use kubectl logs -f <pod-id>, but it doesn’t help if you want to monitor more than one pod at a time.
This is something you really need a lot, at least if you run several instances of a pod behind a deployment. This is even more so if you don’t have a Kibana or a similar setup.
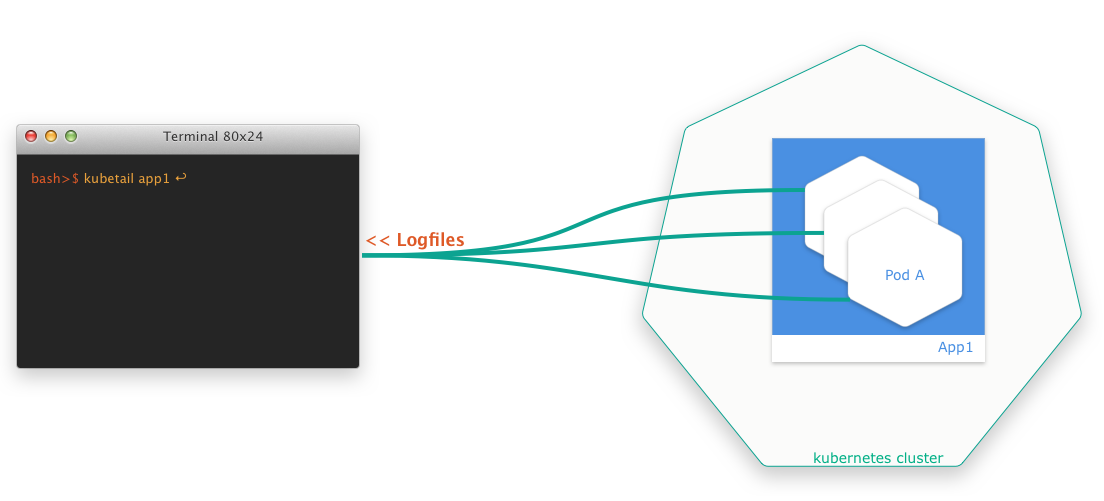
Solution
Luckily, there are smart developers out there who always come up with solutions. The finding of the week is a small bash script that allows you to aggregate log files of several pods at the same time in a simple way. The script is called kubetail and is available at GitHub.