Logging Stack
Motivation
Kubernetes uses the underlying container runtime logging, which does not persist logs for stopped and destroyed containers. This makes it difficult to investigate issues in the very common case of not running containers. Gardener provides a solution to this problem for the managed cluster components by introducing its own logging stack.
Components
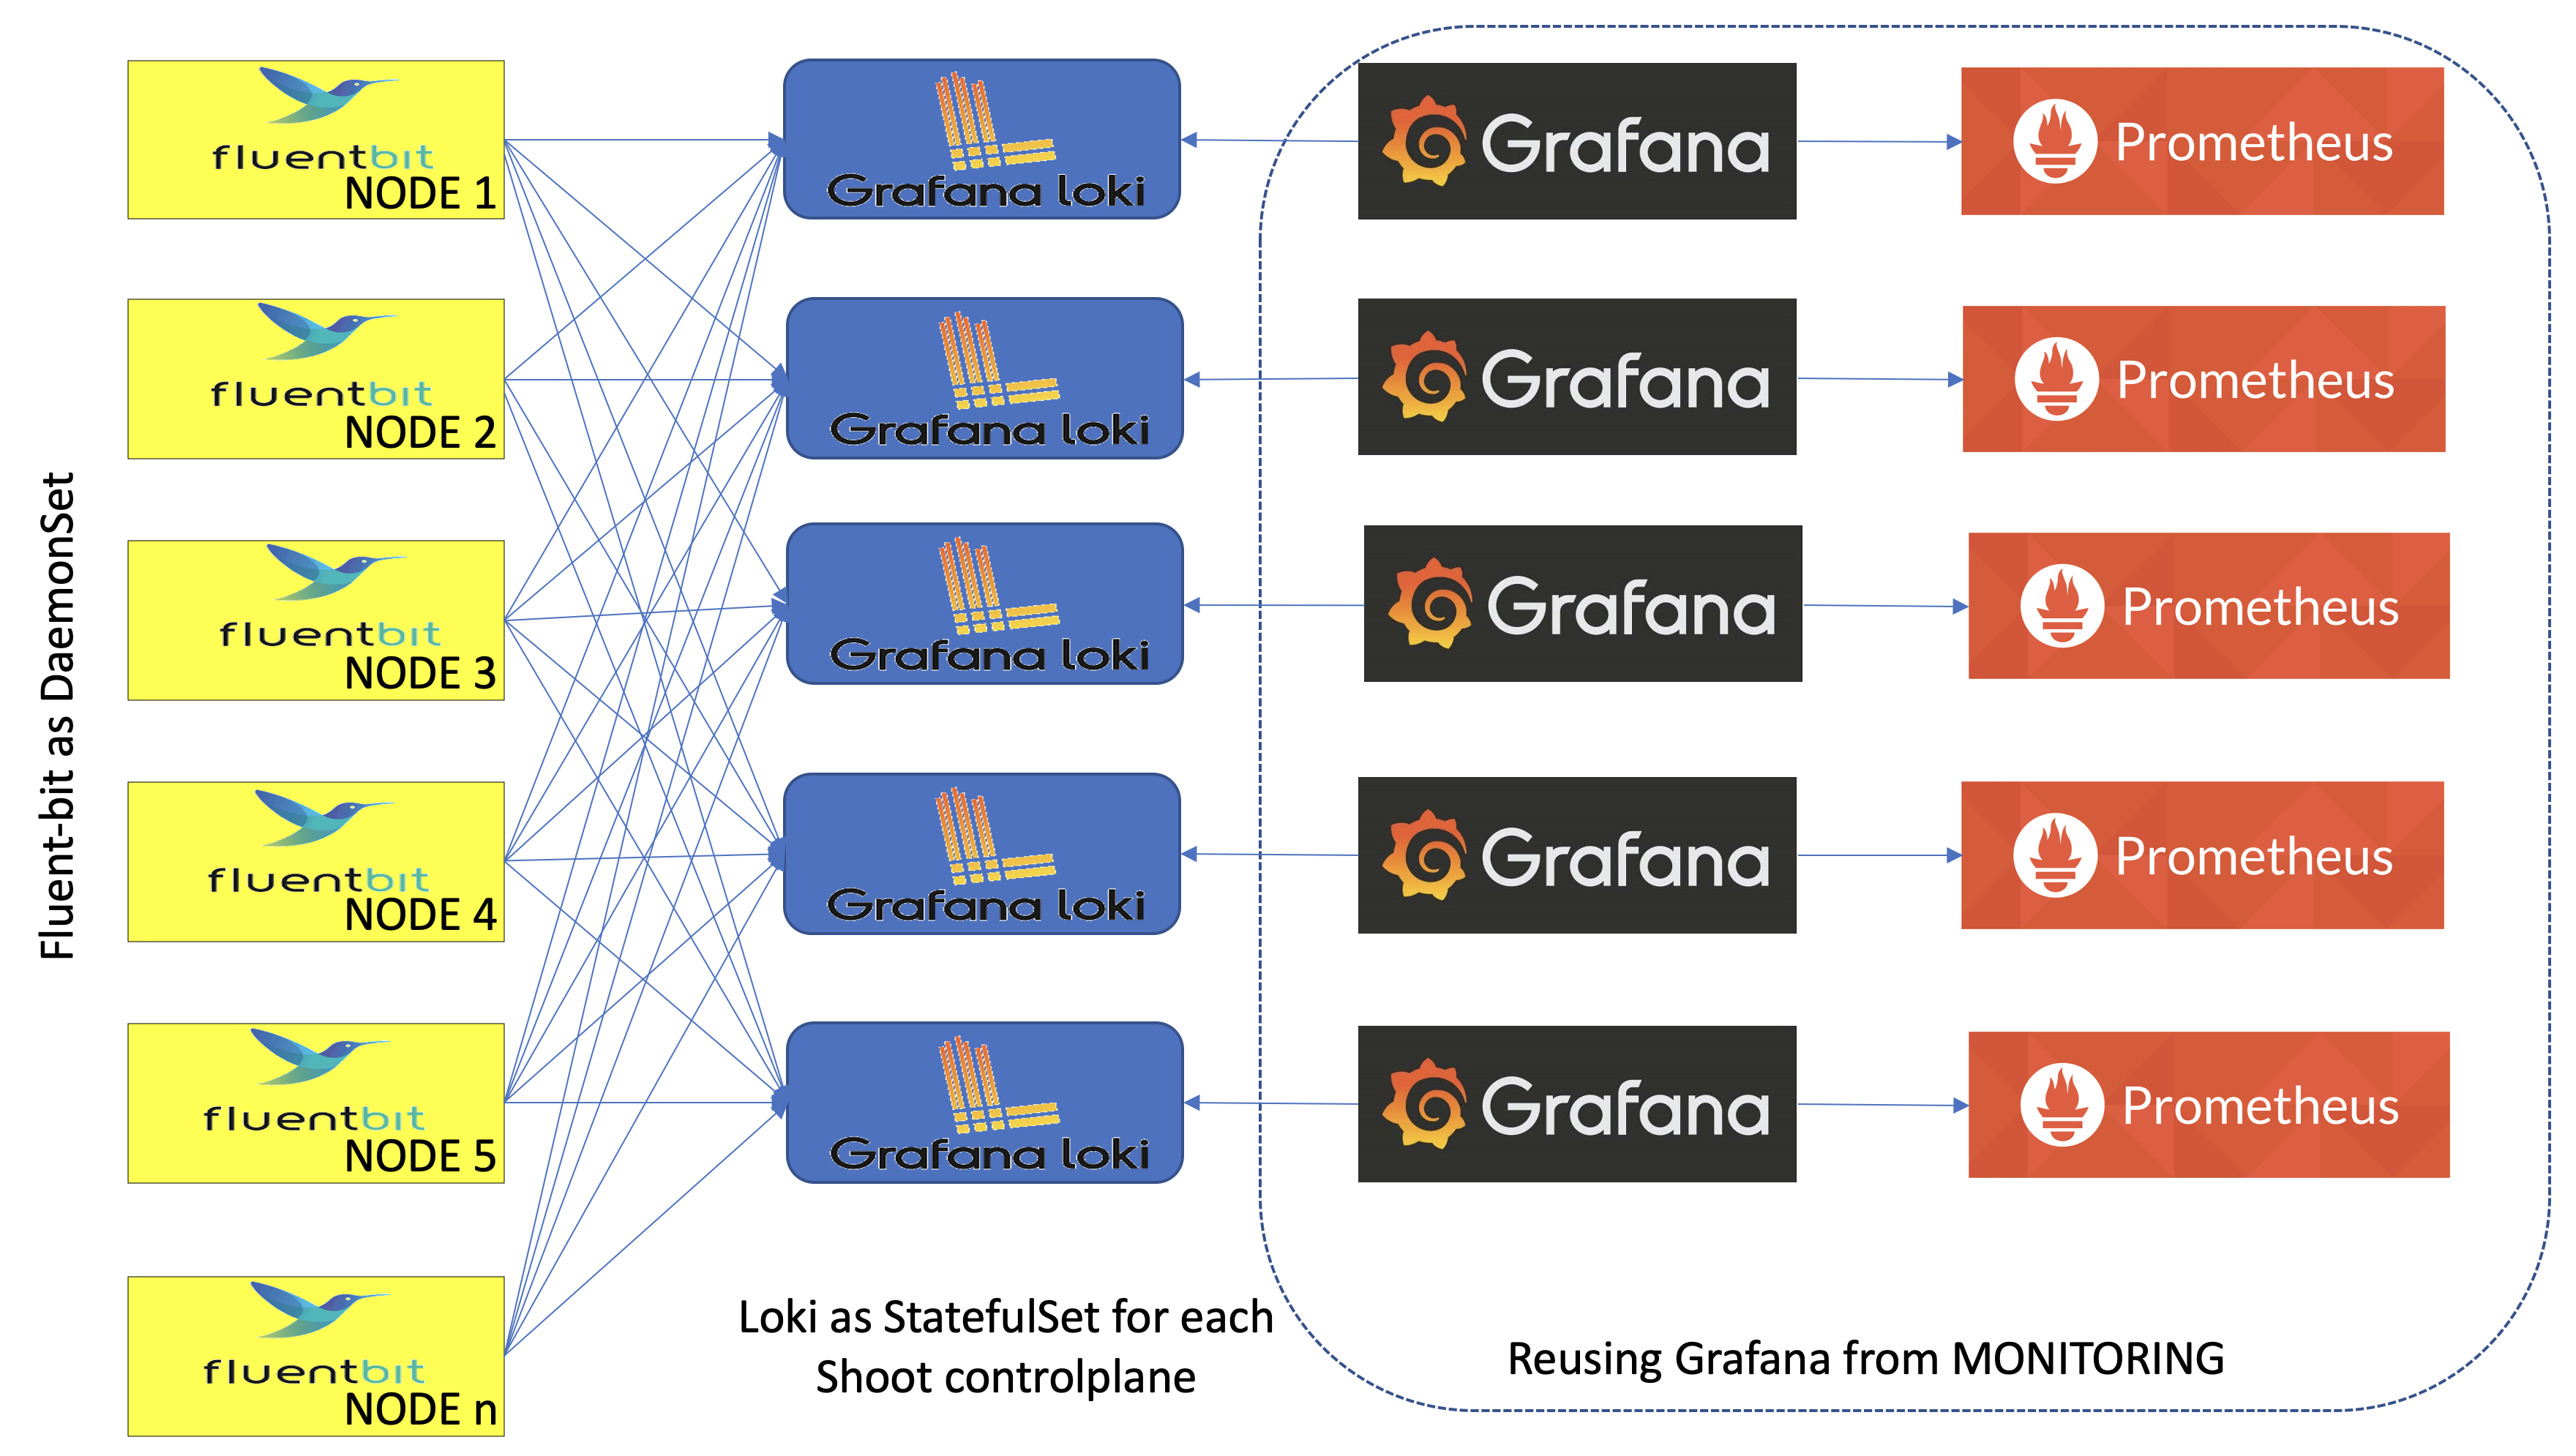
- A Fluent-bit daemonset which works like a log collector and custom Golang plugin which spreads log messages to their Vali instances.
- One Vali Statefulset in the
gardennamespace which contains logs for the seed cluster and one per shoot namespace which contains logs for shoot's controlplane. - One Plutono Deployment in
gardennamespace and two Deployments per shoot namespace (one exposed to the end users and one for the operators). Plutono is the UI component used in the logging stack.

Container Logs Rotation and Retention in kubelet
It is possible to configure the containerLogMaxSize and containerLogMaxFiles fields in the Shoot specification. Both fields are optional and if nothing is specified, then the kubelet rotates on the size 100M. Those fields are part of provider's workers definition. Here is an example:
spec:
  provider:
    workers:
      - cri:
          name: containerd
        kubernetes:
          kubelet:
            # accepted values are of resource.Quantity
            containerLogMaxSize: 150Mi
            containerLogMaxFiles: 10
The values of the containerLogMaxSize and containerLogMaxFiles fields need to be considered with care since container log files claim disk space from the host. On the opposite side, log rotations on too small sizes may result in frequent rotations which can be missed by other components (log shippers) observing these rotations.
In the majority of the cases, the defaults should do just fine. Custom configuration might be of use under rare conditions.
Logs Retention in Vali
Logs in Vali are preserved for a maximum of 14 days. Note that the retention period is also restricted to the Vali's persistent volume size and in some cases, it can be less than 14 days. The oldest logs are deleted when a configured threshold of free disk space is crossed.
Extension of the Logging Stack
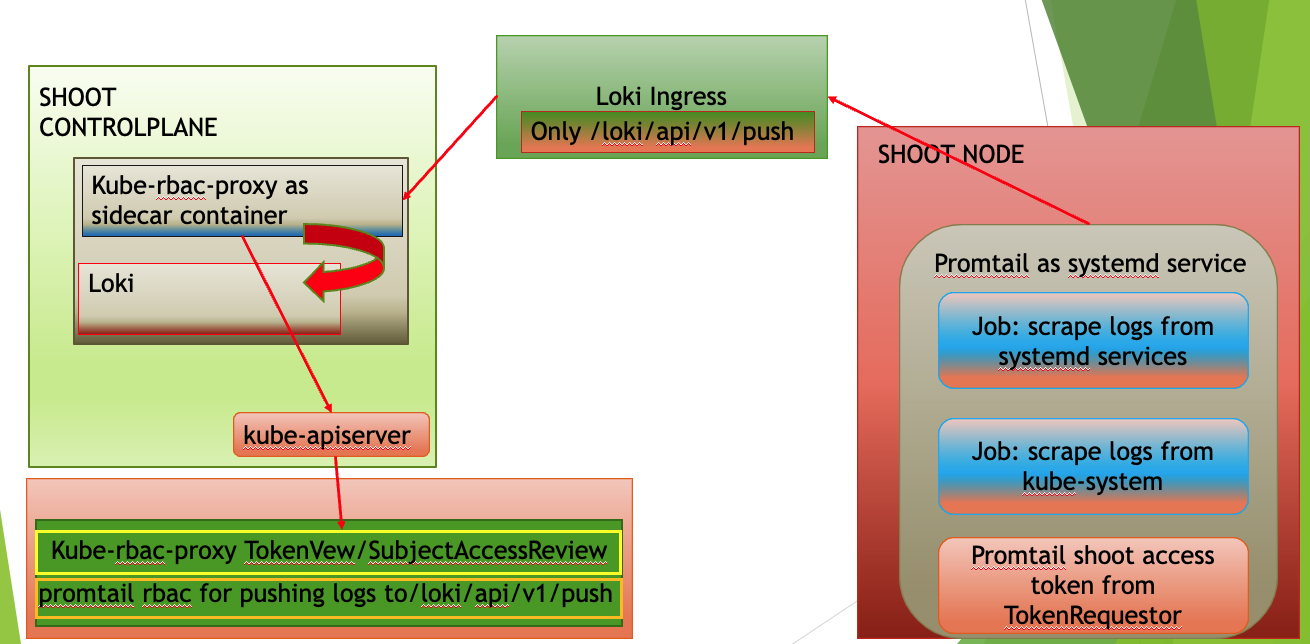
The logging stack is extended to scrape logs from the systemd services of each shoots' nodes and from all Gardener components in the shoot kube-system namespace. These logs are exposed only to the Gardener operators.
Also, in the shoot control plane an event-logger pod is deployed, which scrapes events from the shoot kube-system namespace and shoot control-plane namespace in the seed. The event-logger logs the events to the standard output. Then the fluent-bit gets these events as container logs and sends them to the Vali in the shoot control plane (similar to how it works for any other control plane component). 
How to Access the Logs
The logs are accessible via Plutono. To access them:
Authenticate via basic auth to gain access to Plutono.
The secret containing the credentials is stored in the project namespace following the naming pattern<shoot-name>.monitoring. In this secret you can also find the Plutono URL in theplutono-urlannotation. For Gardener operators, the credentials are also stored in the control-plane (shoot--<project-name>--<shoot-name>) namespace in theobservability-ingress-users-<hash>secret in the seed.Plutono contains several dashboards that aim to facilitate the work of operators and users. From the
Exploretab, users and operators have unlimited abilities to extract and manipulate logs.
Note: Gardener Operators are people part of the Gardener team with operator permissions, not operators of the end-user cluster!
How to Use the Explore Tab
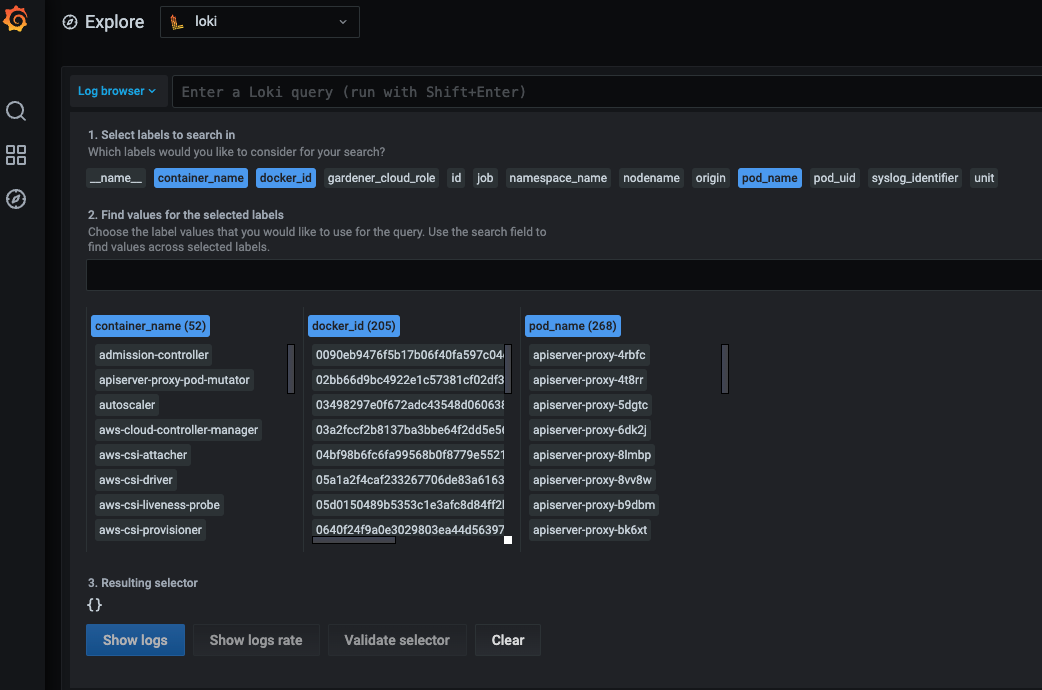
If you click on the Log browser > button, you will see all of the available labels. Clicking on the label, you can see all of its available values for the given period of time you have specified. If you are searching for logs for the past one hour, do not expect to see labels or values for which there were no logs for that period of time. By clicking on a value, Plutono automatically eliminates all other labels and/or values with which no valid log stream can be made. After choosing the right labels and their values, click on the Show logs button. This will build Log query and execute it. This approach is convenient when you don't know the label names or their values. 
Once you feel comfortable, you can start to use the LogQL language to search for logs. Next to the Log browser > button is the place where you can type log queries.
Examples:
If you want to get logs for
calico-node-<hash>pod in the clusterkube-system: The name of the node on whichcalico-nodewas running is known, but not the hash suffix of thecalico-nodepod. Also we want to search for errors in the logs.{pod_name=~"calico-node-.+", nodename="ip-10-222-31-182.eu-central-1.compute.internal"} |~ "error"Here, you will get as much help as possible from the Plutono by giving you suggestions and auto-completion.
If you want to get the logs from
kubeletsystemd service of a given node and search for a pod name in the logs:{unit="kubelet.service", nodename="ip-10-222-31-182.eu-central-1.compute.internal"} |~ "pod name"
Note: Under
unitlabel there is only thedocker,containerd,kubeletandkernellogs.
If you want to get the logs from
gardener-node-agentsystemd service of a given node and search for a string in the logs:{job="systemd-combine-journal",nodename="ip-10-222-31-182.eu-central-1.compute.internal"} | unpack | unit="gardener-node-agent.service"
Note:
{job="systemd-combine-journal",nodename="<node name>"}stream pack all logs from systemd services exceptdocker,containerd,kubelet, andkernel. To filter those log by unit, you have to unpack them first.
- Retrieving events:
If you want to get the events from the shoot
kube-systemnamespace generated bykubeletand related to thenode-problem-detector:{job="event-logging"} | unpack | origin_extracted="shoot",source="kubelet",object=~".*node-problem-detector.*"If you want to get the events generated by MCM in the shoot control plane in the seed:
{job="event-logging"} | unpack | origin_extracted="seed",source=~".*machine-controller-manager.*"Note: In order to group events by origin, one has to specify
origin_extractedbecause theoriginlabel is reserved for all of the logs from the seed and theevent-loggerresides in the seed, so all of its logs are coming as they are only from the seed. The actual origin is embedded in the unpacked event. When unpacked, the embeddedoriginbecomesorigin_extracted.