
Getting Started with OpenTelemetry on a Gardener Shoot Cluster
In this blog post, we will explore how to set up an OpenTelemetry based observability stack on a Gardener shoot cluster. OpenTelemetry is an open-source observability framework that provides a set of APIs, SDKs, agents, and instrumentation to collect telemetry data from applications and systems. It provides a unified approach for collecting, processing, and exporting telemetry data such as traces, metrics, and logs. In addition, it gives flexibility in designing observability stacks, helping avoid vendor lock-in and allowing users to choose the most suitable tools for their use cases.
Here we will focus on setting up OpenTelemetry for a Gardener shoot cluster, collecting both logs and metrics and exporting them to various backends. We will use the OpenTelemetry Operator to simplify the deployment and management of OpenTelemetry collectors on Kubernetes and demonstrate some best practices for configuration including security and performance considerations.
Prerequisites
To follow along with this guide, you will need:
- A Gardener Shoot Cluster.
kubectlconfigured to access the cluster.shoot-cert-serviceenabled on the shoot cluster, to manage TLS certificates for the OpenTelemetry Collectors and backends.
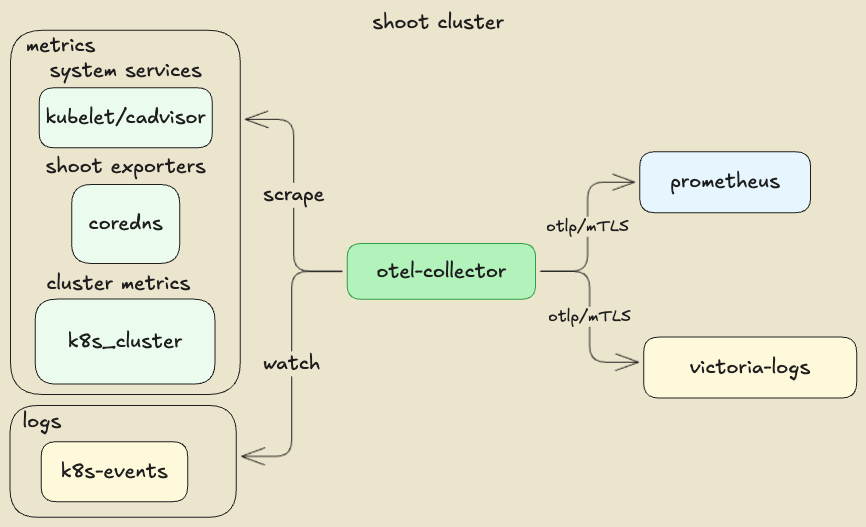
Component Overview of the Sample OpenTelemetry Stack
Setting Up a Gardener Shoot for mTLS Certificate Management
Here we use a self managed mTLS architecture with an illustration purpose. In a production environment, you would typically use a managed certificate authority (CA) or a service mesh to handle mTLS certificates and encryption. However, there might be cases where you want to have flexibility in authentication and authorization mechanisms, for example, by leveraging Kubernetes RBAC to determine whether a service is authorized to connect to a backend or not. In our illustration, we will use a kube-rbac-proxy as a sidecar to the backends, to enforce the mTLS authentication and authorization. The kube-rbac-proxy is a reverse proxy that uses Kubernetes RBAC to control access to services, allowing us to define fine-grained access control policies.
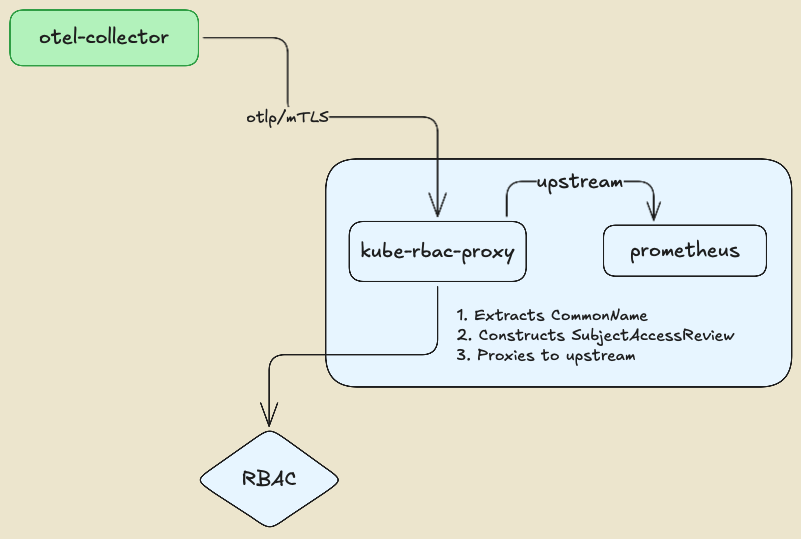
The kube-rbac-proxy extracts the identity of the client (OpenTelemetry collector) from the CommonName (CN) field of the TLS certificate and uses it to perform authorization checks against the Kubernetes API server. This enables fine-grained access control policies based on client identity, ensuring that only authorized clients can connect to the backends.
First, set up the Issuer certificate in the Gardener shoot cluster, allowing you to later issue and manage TLS certificates for the OpenTelemetry collectors and the backends. To allow a custom issuer, the shoot cluster shall be configured with the shoot-cert-service extension.
kind: Shoot
apiVersion: core.gardener.cloud/v1beta1
metadata:
  name: my-shoot
  namespace: my-project
...
spec:
  extensions:
    - type: shoot-cert-service
      providerConfig:
        apiVersion: service.cert.extensions.gardener.cloud/v1alpha1
        kind: CertConfig
        shootIssuers:
          enabled: true
...
Once the shoot is reconciled, the Issuer.cert.gardener.cloud resources will be available. We can use openssl to create a self-signed CA certificate that will be used to sign the TLS certificates for the OpenTelemetry Collector and backends.
openssl genrsa -out ./ca.key 4096
openssl req -x509 -new -nodes -key ./ca.key -sha256 -days 365 -out ./ca.crt -subj "/CN=ca"
# Create namespace and apply the CA secret and issuer
kubectl create namespace certs \
    --dry-run=client -o yaml | kubectl apply -f -

# Create the CA secret in the certs namespace
kubectl create secret tls ca --namespace certs \
    --key=./ca.key --cert=./ca.crt \
    --dry-run=client -o yaml | kubectl apply -f -
Next, we will create the cluster Issuer resource, referencing the CA secret we just created.
apiVersion: cert.gardener.cloud/v1alpha1
kind: Issuer
metadata:
  name: issuer-selfsigned
  namespace: certs
spec:
  ca:
    privateKeySecretRef:
      name: ca
      namespace: certs
Later, we can create Certificate resources to securely connect the OpenTelemetry collectors to the backends.
Setting Up the OpenTelemetry Operator
To deploy the OpenTelemetry Operator on your Gardener Shoot Cluster, we can use the project helm chart with a minimum configuration. The important part is to set the collector image to the latest contrib distribution image which determines the set of receivers, processors, and exporters plugins that will be available in the OpenTelemetry collector instance. There are several pre-built distributions available such as: otelcol, otelcol-contrib, otelcol-k8s, otelcol-otlp, and otelcol-ebpf-profiler. For the purpose of this guide, we will use the otelcol-contrib distribution, which includes a wide range of plugins for various backends and data sources.
manager:
  collectorImage:
    repository: "otel/opentelemetry-collector-contrib"
Setting Up the Backends (prometheus, victoria-logs)
Setting up the backends is a straightforward process. We will use plain resource manifests for illustration purposes, outlining the important parts allowing OpenTelemetry collectors to connect securely to the backends using mTLS. An important part is enabling the respective OTLP ingestion endpoints on the backends, which will be used by the OpenTelemetry collectors to send telemetry data. In a production environment, the lifecycle of the backends will be probably managed by the respective component's operators
Setting Up Prometheus (Metrics Backend)
Here is the complete list of manifests for deploying a single prometheus instance with the OTLP ingestion endpoint and a kube-rbac-proxy sidecar for mTLS authentication and authorization:
Prometheus Certificate That is the serving certificate of the
kube-rbac-proxysidecar. The OpenTelemetry collector needs to trust the signing CA, hence we use the sameIssuerwe created earlier.Prometheus The prometheus needs to be configured to allow
OTLPingestion endpoint:--web.enable-OTLP-receiver. That allows the OpenTelemetry collector to push metrics to the Prometheus instance (via thekube-rbac-proxysidecar).Prometheus Configuration In Prometheus' case, the
OpenTelemetryresource attributes usually set by the collectors can be used to determine labels for the metrics. This is illustrated in the collector'sprometheusreceiver configuration. A common and unified set of labels across all metrics collected by the OpenTelemetry collector is a fundamental requirement for sharing and understanding the data across different teams and systems. This common set is defined by the OpenTelemetry Semantic Conventions specification. For example ,k8s.pod.name,k8s.namespace.name,k8s.node.name, etc. are some of the common labels that can be used to identify the source of the observability signals. Those are also common across the different types of telemetry data (traces, metrics, logs), serving correlation and analysis use cases.mTLS Proxy rbac This example defines a
Roleallowing requests to the prometheus backend to pass the kube-rbac-proxy.yamlrules: - apiGroups: ["authorization.kubernetes.io"] resources: - observabilityapps/prometheus verbs: ["get", "create"] # GET, POSTIn this example, we allow
GETandPOSTrequests to reach the prometheus upstream service, if the request is authenticated with a valid mTLS certificate and the identified user is allowed to access the Prometheus service by the correspondingRoleBinding.PATCHandDELETErequests are not allowed. The mapping between the http request methods and the Kubernetes RBAC verbs is seen at kube-rbac-proxy/proxy.go.yamlsubjects: - apiGroup: rbac.authorization.k8s.io kind: User name: clientmTLS Proxy resource-attributes
kube-rbac-proxycreates KubernetesSubjectAccessReviewto determine if the request is allowed to pass. TheSubjectAccessReviewis created with theresourceAttributesset to the upstream service, in this case the Prometheus service.
Setting Up victoria-logs (Logs Backend)
In our example, we will use victoria-logs as the logs backend. victoria-logs is a high-performance, cost-effective, and scalable log management solution. It is designed to work seamlessly with Kubernetes and provides powerful querying capabilities. It is important to note that any OTLP compatible backend can be used as a logs backend, allowing flexibility in choosing the best tool for the concrete needs.
Here is the complete manifests for deploying a single victoria-logs instance with the OTLP ingestion endpoint enabled and kube-rbac-proxy sidecar for mTLS authentication and authorization, using the upstream helm chart:
- Victoria-Logs Certificate That is the serving certificate of the
kube-rbac-proxysidecar. The OpenTelemetry collector needs to trust the signing CA hence we use the sameIssuerwe created earlier. - Victoria-Logs chart values The certificate secret shall be mounted in the VictoriaLogs pod as a volume, as it is referenced by the
kube-rbac-proxysidecar. - Victoria-Logs mTLS Proxy rbac There is no fundamental difference compared to how we configured the Prometheus mTLS proxy. The
Roleallows requests to the VictoriaLogs backend to pass the kube-rbac-proxy. - Victoria-Logs mTLS Proxy resource-attributes
By now we shall have a working Prometheus and victoria-logs backends, both secured with mTLS and ready to accept telemetry data from the OpenTelemetry collector.
Setting Up the OpenTelemetry Collectors
We are going to deploy two OpenTelemetry collectors: k8s-events and shoot-metrics. Both collectors will emit their own telemetry data in addition to the data collected from the respective receivers.
k8s-events collector
In this example, we use 2 receivers:
- k8s_events receiver to collect Kubernetes events from the cluster.
- k8s_cluster receiver to collect Kubernetes cluster metrics.
Here is an example of Kubernetes events persited in the victoria-logs backend. It filters logs which represents events from kube-system namesapce related to a rollout restart of the target statefulset. Then it formats the UI to show the event reason and object name. 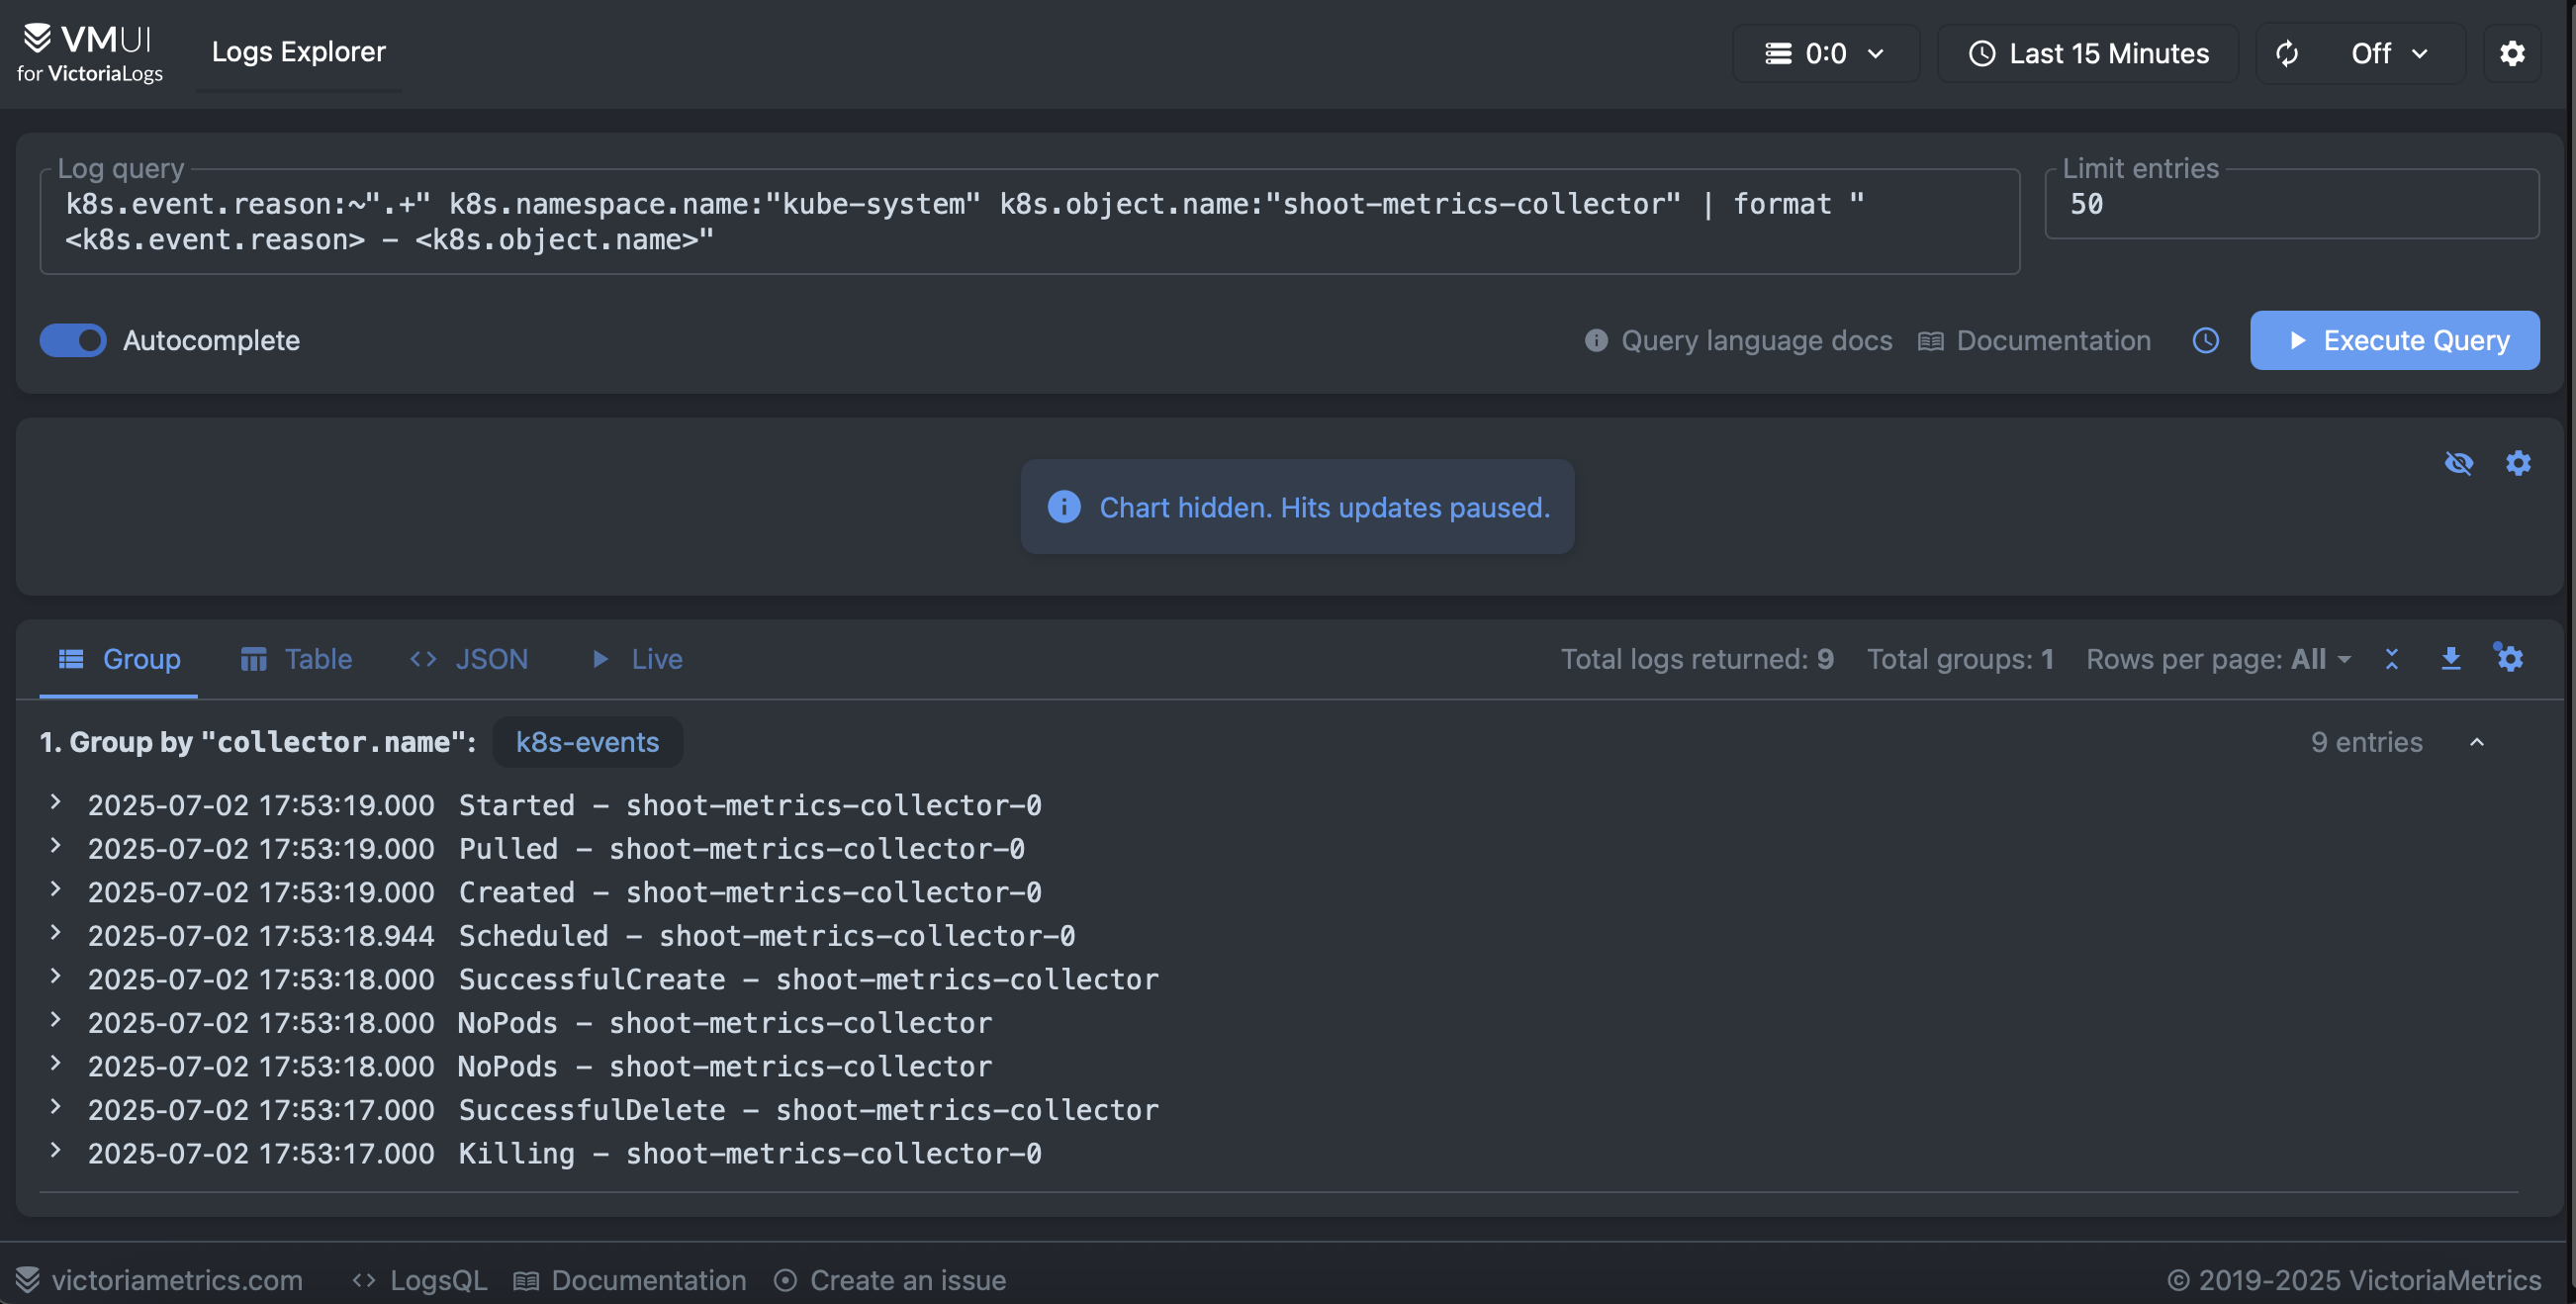
The collector features few important configurations related to reliability and performance. The collected metrics points are are sent in batches to the Prometheus backend using the corresponding OTLP exporter and the memory consumption of the collector is also limited. In general, it is always a good practice to set a memory limiter and batch processing in the collector pipeline.
processors:
  memory_limiter:
    check_interval: 1s
    limit_percentage: 80
    spike_limit_percentage: 2
  batch:
    timeout: 5s
    send_batch_size: 1000
Allowing the collector to emit its own telemetry data is configured in the service section of the collector configuration.
service:
  # Configure the collector own telemetry
  telemetry:
    # Emit collector logs to stdout, you can also push them to a backend.
    logs:
      level: info
      encoding: console
      output_paths: [stdout]
      error_output_paths: [stderr]
    # Push collector internal metrics to Prometheus
    metrics:
      level: detailed
      readers:
        - # push metrics to Prometheus backend
          periodic:
            interval: 30000
            timeout: 10000
            exporter:
              OTLP:
                protocol: http/protobuf
                endpoint: "${env:PROMETHEUS_URL}/api/v1/OTLP/v1/metrics"
                insecure: false # Ensure server certificate is validated against the CA
                certificate: /etc/cert/ca.crt
                client_certificate: /etc/cert/tls.crt
                client_key: /etc/cert/tls.key
The majority of the samples use an prometheus receiver to scrape the collector metrics endpoint, however that is not a clean solution because it puts the metrics via the pipeline, thus consuming resources and potentially causing performance issues. Instead, we use the periodic reader to push the metrics directly to the Prometheus backend.
Since the k8s-events collector obtains telemetry data from the kube-apiserver, it requires a corresponding set of permissions defined at k8s-events rbac manifests.
shoot-metrics collector
In this example, we have a single receiver:
- prometheus receiver scraping metrics from Gardener managed exporters present in the shoot cluster, including the
kubeletsystem service metrics. This receiver accepts standard Prometheus scrape configurations usingkubernetes_sd_configsto discover the targets dynamically. Thekubernetes_sd_configsallows the receiver to discover Kubernetes resources such as pods, nodes, and services, and scrape their metrics endpoints.
Here, the example illustrates the prometheus receiver scraping metrics from the kubelet service, adding node kubernetes labels as labels to the scraped metrics and filtering the metrics to keep only the relevant ones. Since the kubelet metrics endpoint is secured, it needs the corresponding bearer token to be provided in the scrape configuration. The bearer token is automatically mounted in the pod by Kubernetes, allowing the OpenTelemetry collector to authenticate with the kubelet service.
- job_name: shoot-kube-kubelet
  honor_labels: false
  scheme: https
  tls_config:
    insecure_skip_verify: true
  metrics_path: /metrics
  bearer_token_file: /var/run/secrets/kubernetes.io/serviceaccount/token
  kubernetes_sd_configs:
    - role: node
  relabel_configs:
    - source_labels:
        - job
      target_label: __tmp_prometheus_job_name
    - target_label: job
      replacement: kube-kubelet
      action: replace
    - target_label: type
      replacement: shoot
      action: replace
    - source_labels:
        - __meta_kubernetes_node_address_InternalIP
      target_label: instance
      action: replace
    - regex: __meta_kubernetes_node_label_(.+)
      action: labelmap
      replacement: "k8s_node_label_$${1}"
  metric_relabel_configs:
    - source_labels:
        - __name__
      regex: ^(kubelet_running_pods|process_max_fds|process_open_fds|kubelet_volume_stats_available_bytes|kubelet_volume_stats_capacity_bytes|kubelet_volume_stats_used_bytes|kubelet_image_pull_duration_seconds_bucket|kubelet_image_pull_duration_seconds_sum|kubelet_image_pull_duration_seconds_count)$
      action: keep
    - source_labels:
        - namespace
      regex: (^$|^kube-system$)
      action: keep
The collector also illustrates collecting metrics from cadvisor endpoints and Gardener specific exporters such as shoot-apiserver-proxy, shoot-coredns, etc. The exporters usually reside in the kube-system namespace and are configured to expose metrics on a specific port.
Since we aimed at unified set of resources attribues accross all telemetry data, we can translate exporters metrics which do not conform the conventions in OpenTelemetry. Here is an example of translating the metrics, produced by the kubelet, to the OpenTelemetry conventions using the transform/metrics processor:
# Convert Prometheus metrics names to OpenTelemetry metrics names
transform/metrics:
  error_mode: ignore
  metric_statements:
    - context: datapoint
      statements:
        - set(attributes["k8s.container.name"], attributes["container"]) where attributes["container"] != nil
        - delete_key(attributes, "container") where attributes["container"] != nil
        - set(attributes["k8s.pod.name"], attributes["pod"]) where attributes["pod"] != nil
        - delete_key(attributes, "pod") where attributes["pod"] != nil
        - set(attributes["k8s.namespace.name"], attributes["namespace"]) where attributes["namespace"] != nil
        - delete_key(attributes, "namespace") where attributes["namespace"] != nil
Here is a visualization of container_network_transmit_bytes_total metric collected from the cadvisor endpoint of the kubelet service, showing the network traffic in bytes transmitted by the vpn-shoot containers. 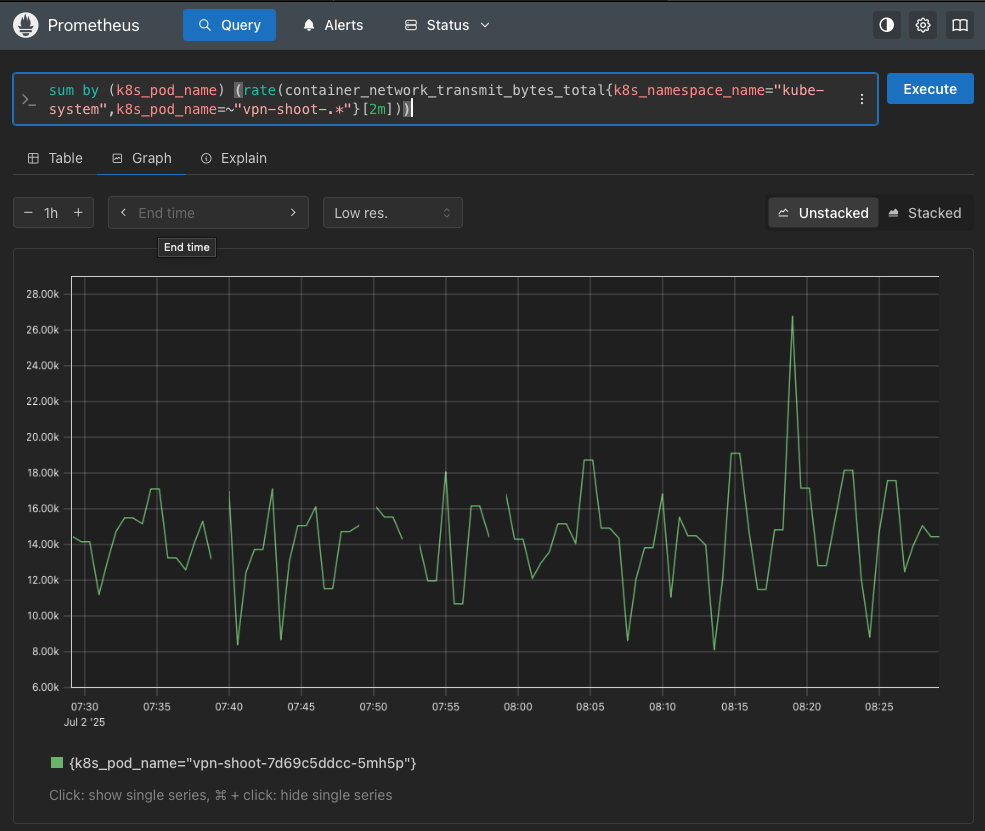
Similarly to the k8s-events collector, the shoot-metrics collector also emits its own telemetry data, including metrics and logs. The collector is configured to push its own metrics to the Prometheus backend using the periodic reader, avoiding the need for a separate Prometheus scrape configuration. It requires a corresponding set of permissions defined at shoot-metrics rbac manifest.
Summary
In this blog post, we have explored how to set up an OpenTelemetry based observability stack on a Gardener Shoot Cluster. We have demonstrated how to deploy the OpenTelemetry Operator, configure the backends prometheus and victoria-logs), and deploy OpenTelemetry collectors to obtain telemetry data from the cluster. We have also discussed best practices for configuration, including security and performance considerations. In this blog we have shown the unified set of resource attributes that can be used to identify the source of the telemetry data, allowing correlation and analysis across different teams and systems. We have demonstrated how to transform metrics labels which do not conform to the OpenTelemetry conventions, achieving a unified set of labels across all telemetry data. Finally, we have illustrated how to securely connect the OpenTelemetry collectors to the backends using mTLS and kube-rbac-proxy for authentication and authorization.
We hope this guide will inspire you to get started with OpenTelemetry on a Gardener managed shoot cluster and equip you with ideas and best practices for building a powerful observability stack that meets your needs. For more information, please refer to the OpenTelemetry documentation and the Gardener documentation.